This is my penultimate look for the 2010/11 regular season at which teams have been hit hardest by injuries by trying to place a value on the games missed by players due to injury/illness. (Last month's analysis is HERE.)
The concept again - multiply each game missed by a player by his 2010/11 cap charge, then take the aggregate of these figures for each team and divide by 82. This indicator of value lost to a team by injury/illness is called CHIP (Cap Hit of Injured Players).
Alternatively...
Again, for a different indicator of player "value", I've also illustrated a similar metric based on TOI/G alongside the CHIP numbers. Clearly, neither cap charge nor TOI/G are perfect measures of player value, since each have a number of limitations and inconsistencies, but they provide a decent comparison and the results do vary somewhat.A quick summary of the alternative metric:
- TOI/G (through games played on 28 February) replaces cap charge as the measure of value in the calculation
- For goalies, TOI/G has been worked out as Total Minutes Played / Games Dressed For* - i.e. a goalie playing every minute of 75% of the games, zero in the rest, would end up with a TOI/G of 45 minutes (or close to it, once you factor in OT and so on). [*Actually, "Games Played by Team - Games Missed by Goalie" - I'm not inclined to disentangle any three-goalie systems or minor-league conditioning stints.]
- This arguably overstates the worth of starting goalies somewhat, but it's simple and you could equally argue that a workhorse goalie is the hardest position to replace, so it's fair for them to have a much higher TOI/G figure
- Where a player hasn't played all year (several examples at this point of the season) or where a player fairly clearly has a reduced TOI/G figure due to getting injured in their only game or one of very few games, I've used TOI/G from last season (or further back if necessary)
- For each player, multiply games missed by TOI/G to get (for a more palatable name) Cumulative Minutes of Injured Player (CMIP)
- Take the aggregate of CMIP for the team and divide by games played by the team to arrive at AMIP (Average Minutes of Injured Players) - it feels more understandable expressing this metric as an average per game (whereas CHIP is a running total)
The table below shows:
- Total CHIP for each team for the 2010/11 regular season (through games played on 28 February)
- The player who has contributed most to the team's CHIP figure
- The number of players with a CHIP contribution of over $250,000 (think of it as being equivalent to a $1m player missing 20 games or a $4m player missing five games)
- AMIP for each team over the same period (e.g. an AMIP of 40:00 could be seen as the team missing two 20-minute per game players for every game this season)

For a further breakdown, the following table also shows the distribution of CHIP by position for each team:

10 second analysis...
The recent emergency call-ups of Dave Babych and Adrien Plavsic by the Canucks prompted my thought to break down the CHIP figures by position. Somewhat more instructive to see, therefore, the Canucks and Canadiens 2nd and 3rd in defensemen CHIP (CHID?) as you might anticipate. Less instructive to see them still lagging behind Mark Streit and a plethora of minor-league D-men in first place.
And the Islanders, Leafs and Senators can clearly point to injuries as being a huge factor behind their goaltending performances falling behind their normally impeccable standards. Or something...
The next lists are the top 30 individual CHIP and CMIP contributions:


Does Sid the Kid have enough time and remaining cap hit to catch long-time favourites Drury and Markov? Sure, I could work it out, but where is the tension in doing that?
Where does it hurt?
This is another update of the crude injury-by-location analysis. Again, I’ve just used the descriptions found in the player profiles on tsn.ca, so the figures will encompass all the inaccuracies and vagueness within them. It should give a broad indication, if nothing else, though.

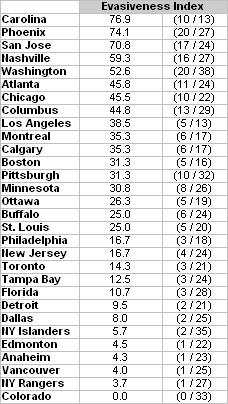
And as an extra, further final bonus, a second look at the Evasiveness Index introduced last month. This is basically the proportion of injury instances for each team that have been described as either "Undisclosed" or the helpfully pointless "Upper/Lower Body" in the same TSN profiles. I have made no judgement about whether the many instances of "Illness" (i.e. concussion), "Flu" (i.e. concussion) or even "Boogaard Shoulder" (i.e. concussion) should also be included.
Notes/Disclaimers
- Figures exclude a few minor-leaguers / marginal NHLers who are or had been on the NHL club’s IR since pre-season. Generally, if a minor-leaguer gets called up and then injured in an NHL game, his games missed will then count towards the CHIP though. I've tried to exclude minor-league conditioning stints immediately after/during a period on IR from the man-games lost figures
- There are undoubtedly a few inaccuracies and inconsistencies in there - I do the best I can with the information out there. Some corrections are picked up month-to-month too
- The cap figure doesn't really correlate very well to the "worth" of a player in some cases, e.g. where rookie bonuses are included this year, where players are seeing out an old (underpaid or rookie) contract or where players are horrendously overpaid
- Also, for any player who was acquired on re-entry waivers (e.g. Sean Avery), the cap hit will only reflect that for their current team, i.e. 50% of the player’s full cap hit (shared between his current and old teams)
- I've once again stuck a full team-by-team listing of games missed and CHIP/CMIP numbers by each player on the web HERE
- Injury/games/TOI info courtesy of tsn.ca and nhl.com - man-games lost info more than likely does not exactly match up with the "official" figures released by individual teams
- Cap info courtesy of capgeek.com

"Pittsburgh for one, seem to have suddenly clammed up when it comes to injury disclosure. A policy that sadly has not yet extended to its TV broadcast team."
ReplyDeletehilarious. I am amazed Wings don't rank higher on the evasiveness scale- its our way to clam up about injury- then again maybe that is why you don't have us ranked higher. We are so tight lipped, you don't even KNOW we have injuries...