23 April 2011

The Pain Game 2010/11 - end of season wrap

Injury stats update – end of season awards

This is the final update for the 2010/11 regular season looking at which teams have been hit hardest by injuries by trying to place a value on the games missed by players due to injury/illness.  (Last month's analysis is HERE.)

The concept again - multiply each game missed by a player by his 2010/11 cap charge, then take the aggregate of these figures for each team and divide by 82. This indicator of value lost to a team by injury/illness is called CHIP (Cap Hit of Injured Players).

Alternatively...
Again, for a different indicator of player "value", I've also illustrated a similar metric based on TOI/G alongside the CHIP numbers.  Clearly, neither cap charge nor TOI/G are perfect measures of player value, since each have a number of limitations and inconsistencies, but they provide a decent comparison and the results do vary somewhat.

A quick summary of the alternative metric:
  • TOI/G replaces cap charge as the measure of value in the calculation
  • For goalies, TOI/G has been worked out as Total Minutes Played / Games Dressed For* - i.e. a goalie playing every minute of 75% of the games, zero in the rest, would end up with a TOI/G of 45 minutes (or close to it, once you factor in OT and so on).  [*Actually, "Games Played by Team - Games Missed by Goalie" - I'm not inclined to disentangle any three-goalie systems or minor-league conditioning stints.]
  • This arguably overstates the worth of starting goalies somewhat, but it's simple and you could equally argue that a workhorse goalie is the hardest position to replace, so it's fair for them to have a much higher TOI/G figure
  • Where a player hasn't played all year (several examples at this point of the season) or where a player fairly clearly has a reduced TOI/G figure due to getting injured in their only game or one of very few games, I've used TOI/G from last season (or further back if necessary)
  • For each player, multiply games missed by TOI/G to get (for a more palatable name) Cumulative Minutes of Injured Player (CMIP)
  • Take the aggregate of CMIP for the team and divide by games played by the team to arrive at AMIP (Average Minutes of Injured Players) - it feels more understandable expressing this metric as an average per game (whereas CHIP is a running total)
The figures...
The table below (playoff teams highlighted in yellow) shows:
  • Total CHIP for each team over the 2010/11 regular season
  • The player who has contributed most to the team's CHIP figure
  • The number of players with a CHIP contribution of over $250,000 (think of it as being equivalent to a $1m player missing 20 games or a $4m player missing five games)
  • AMIP for each team over the same period (e.g. an AMIP of 40:00 could be seen as the team missing two 20-minute per game players for every game this season)

For a further breakdown, the following table also shows the distribution of CHIP by position for each team:


10 second analysis...
After a late surge that surely nobody could have seen coming, given the scandalous lack of media coverage, the Penguins clinch the title of Most Benign Videos of a Player Appearing at Practice Released to the Public Most Injured Team in the NHL 2010/11.

The plucky Rangers saw their chance of an unprecedented worst-to-first run dashed by Ryan Callahan's inability to break himself on a Zdeno Chara slapshot quite early enough in the season and Glen Sather's unfathomable decision not to tack another million per year on Derek Boogaard's bargain contract.

At the other end of the table, Carolina's rather massive separation from the field only made my amusement at their Game 82 wipeout increase, when their colour analyst (colour: orange) Tripp Tracy decided to claim injuries were a major factor in the team's failure to make the playoffs within two minutes of the game ending.

Despite the cluster of non-playoff teams towards the top of the CHIP table, I'm still not that convinced there is much of a correlation with performance overall - of those teams, only really the Devils' failure could be argued as being much of a surprise.

Not sure how the injured Penguins forwards have been rated as having more value than the long Drury/Boogaard absences for the Rangers, but then I never claimed the system was perfect.  And where would the Senators, Leafs, Wild and Islanders have been without the costly injuries to Leclaire, Giguere, Harding and a bunch of minor league goalies respectively?

Now I have three years' worth of the data (2008/09 analysis and 2009/10 analysis), I will consider doing a post with some sort of wider annual comparisons.  For now, worth noting that the league-wide aggregate CHIP figure of around $234m is higher than each of the last two years - though increases in average contract size may well play a part in this.

The next lists are the top 30 individual CHIP and CMIP contributions:

Andrei Markov follows up a strong 13th place finish in 2009/10 to just hold off Captain Clutch for the individual CHIP title.  Surely cause for celebration in Montreal.  Stay away from parked cars, Andrei.

Mark Streit's season-long presence in the press box would have been a crushing blow for the Islanders.  Had he not had his credentials revoked by the team in November, of course.

Players who missed all 82 games: Sauer (Phoenix), Mueller (Colorado), Harding (Minnesota), Sheppard (Minnesota), Salvador (New Jersey), Streit (NY Islanders), Laperriere (Philadelphia), Bitz (Florida).

Where does it hurt?
This is another update of the crude injury-by-location analysis. Again, I’ve just used the descriptions found in the player profiles on tsn.ca, so the figures will encompass all the inaccuracies and vagueness within them. It should give a broad indication, if nothing else, though.


And as an extra, further final bonus, a final look at the Evasiveness Index.  This is basically the proportion of injury instances for each team that have been described as either "Undisclosed" or the helpfully pointless "Upper/Lower Body" in the same TSN profiles.  I have made no judgement about whether the many instances of "Illness" (i.e. concussion), "Flu" (i.e. concussion) or even "Boogaard Shoulder" (i.e. concussion) should also be included.

Carolina uncharacteristically blew their chance of victory here by deciding to disclose a couple of injuries down the stretch.  Greg Sherman clearly has a lot to learn, or too much time on his hands, managing to disclose each one of 46 different injuries to 29 different players.  Not including Peter Forsberg.


Notes/Disclaimers
  • Figures exclude a few minor-leaguers / marginal NHLers who are or had been on the NHL club’s IR since pre-season. Generally, if a minor-leaguer gets called up and then injured in an NHL game, his games missed will then count towards the CHIP though.  I've tried to exclude minor-league conditioning stints immediately after/during a period on IR from the man-games lost figures
  • There are undoubtedly a few inaccuracies and inconsistencies in there - I do the best I can with the information out there. Some corrections are picked up month-to-month too
  • The cap figure doesn't really correlate very well to the "worth" of a player in some cases, e.g. where rookie bonuses are included this year, where players are seeing out an old (underpaid or rookie) contract or where players are horrendously overpaid
  • Also, for any player who was acquired on re-entry waivers (e.g. Sean Avery), the cap hit will only reflect that for their current team, i.e. 50% of the player’s full cap hit (shared between his current and old teams)
  • I've once again stuck a full team-by-team listing of games missed and CHIP/CMIP numbers by each player on the web HERE
  • Injury/games/TOI info courtesy of tsn.ca and nhl.com - man-games lost info more than likely does not exactly match up with the "official" figures released by individual teams
  • Cap info courtesy of capgeek.com

12 March 2011

The Pain Game 2010/11 - Part Five

Injury stats update – February 2011

This is my penultimate look for the 2010/11 regular season at which teams have been hit hardest by injuries by trying to place a value on the games missed by players due to injury/illness.  (Last month's analysis is HERE.)

The concept again - multiply each game missed by a player by his 2010/11 cap charge, then take the aggregate of these figures for each team and divide by 82. This indicator of value lost to a team by injury/illness is called CHIP (Cap Hit of Injured Players).

Alternatively...
Again, for a different indicator of player "value", I've also illustrated a similar metric based on TOI/G alongside the CHIP numbers.  Clearly, neither cap charge nor TOI/G are perfect measures of player value, since each have a number of limitations and inconsistencies, but they provide a decent comparison and the results do vary somewhat.

A quick summary of the alternative metric:
  • TOI/G (through games played on 28 February) replaces cap charge as the measure of value in the calculation
  • For goalies, TOI/G has been worked out as Total Minutes Played / Games Dressed For* - i.e. a goalie playing every minute of 75% of the games, zero in the rest, would end up with a TOI/G of 45 minutes (or close to it, once you factor in OT and so on).  [*Actually, "Games Played by Team - Games Missed by Goalie" - I'm not inclined to disentangle any three-goalie systems or minor-league conditioning stints.]
  • This arguably overstates the worth of starting goalies somewhat, but it's simple and you could equally argue that a workhorse goalie is the hardest position to replace, so it's fair for them to have a much higher TOI/G figure
  • Where a player hasn't played all year (several examples at this point of the season) or where a player fairly clearly has a reduced TOI/G figure due to getting injured in their only game or one of very few games, I've used TOI/G from last season (or further back if necessary)
  • For each player, multiply games missed by TOI/G to get (for a more palatable name) Cumulative Minutes of Injured Player (CMIP)
  • Take the aggregate of CMIP for the team and divide by games played by the team to arrive at AMIP (Average Minutes of Injured Players) - it feels more understandable expressing this metric as an average per game (whereas CHIP is a running total)
The figures...
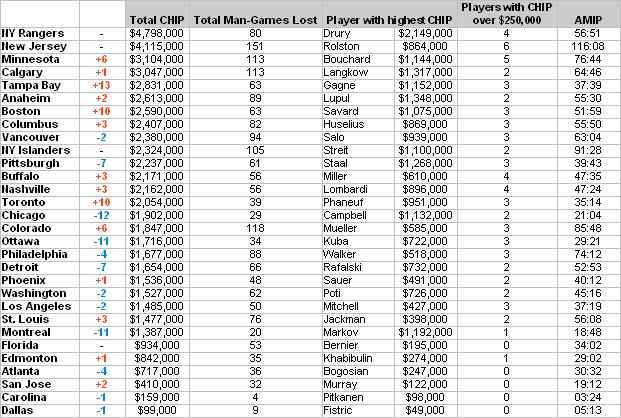
The table below shows:
  • Total CHIP for each team for the 2010/11 regular season (through games played on 28 February)
  • The player who has contributed most to the team's CHIP figure
  • The number of players with a CHIP contribution of over $250,000 (think of it as being equivalent to a $1m player missing 20 games or a $4m player missing five games)
  • AMIP for each team over the same period (e.g. an AMIP of 40:00 could be seen as the team missing two 20-minute per game players for every game this season)

For a further breakdown, the following table also shows the distribution of CHIP by position for each team:


10 second analysis...
The horrendous travel schedule in the Atlantic Division is clearly the single biggest contributing factor in the presence of 80% of the division in the top four slots, now that the Penguins have risen (somebody should really have publicised their recent injuries - I'd never have noticed otherwise...)

The recent emergency call-ups of Dave Babych and Adrien Plavsic by the Canucks prompted my thought to break down the CHIP figures by position.  Somewhat more instructive to see, therefore, the Canucks and Canadiens 2nd and 3rd in defensemen CHIP (CHID?) as you might anticipate.  Less instructive to see them still lagging behind Mark Streit and a plethora of minor-league D-men in first place.

And the Islanders, Leafs and Senators can clearly point to injuries as being a huge factor behind their goaltending performances falling behind their normally impeccable standards.  Or something...

The next lists are the top 30 individual CHIP and CMIP contributions:

Does Sid the Kid have enough time and remaining cap hit to catch long-time favourites Drury and Markov?  Sure, I could work it out, but where is the tension in doing that?

Where does it hurt?
This is another update of the crude injury-by-location analysis. Again, I’ve just used the descriptions found in the player profiles on tsn.ca, so the figures will encompass all the inaccuracies and vagueness within them. It should give a broad indication, if nothing else, though.


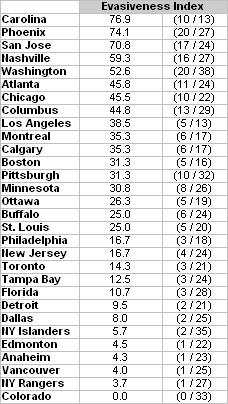
And as an extra, further final bonus, a second look at the Evasiveness Index introduced last month.  This is basically the proportion of injury instances for each team that have been described as either "Undisclosed" or the helpfully pointless "Upper/Lower Body" in the same TSN profiles.  I have made no judgement about whether the many instances of "Illness" (i.e. concussion), "Flu" (i.e. concussion) or even "Boogaard Shoulder" (i.e. concussion) should also be included.

It will be mildly interesting to see if teams become more evasive down the stretch.  Pittsburgh for one, seem to have suddenly clammed up when it comes to injury disclosure.  A policy that sadly has not yet extended to its TV broadcast team.


Notes/Disclaimers
  • Figures exclude a few minor-leaguers / marginal NHLers who are or had been on the NHL club’s IR since pre-season. Generally, if a minor-leaguer gets called up and then injured in an NHL game, his games missed will then count towards the CHIP though.  I've tried to exclude minor-league conditioning stints immediately after/during a period on IR from the man-games lost figures
  • There are undoubtedly a few inaccuracies and inconsistencies in there - I do the best I can with the information out there. Some corrections are picked up month-to-month too
  • The cap figure doesn't really correlate very well to the "worth" of a player in some cases, e.g. where rookie bonuses are included this year, where players are seeing out an old (underpaid or rookie) contract or where players are horrendously overpaid
  • Also, for any player who was acquired on re-entry waivers (e.g. Sean Avery), the cap hit will only reflect that for their current team, i.e. 50% of the player’s full cap hit (shared between his current and old teams)
  • I've once again stuck a full team-by-team listing of games missed and CHIP/CMIP numbers by each player on the web HERE
  • Injury/games/TOI info courtesy of tsn.ca and nhl.com - man-games lost info more than likely does not exactly match up with the "official" figures released by individual teams
  • Cap info courtesy of capgeek.com
30 January 2011

The Pain Game 2010/11 - Part Four

Injury stats update – January 2011

This is my fourth look for the 2010/11 regular season at which teams have been hit hardest by injuries by trying to place a value on the games missed by players due to injury/illness.  (Last month's analysis is HERE.)

The concept again - multiply each game missed by a player by his 2010/11 cap charge, then take the aggregate of these figures for each team and divide by 82. This indicator of value lost to a team by injury/illness is called CHIP (Cap Hit of Injured Players).

Alternatively...
Again, for a different indicator of player "value", I've also illustrated a similar metric based on TOI/G alongside the CHIP numbers.  Clearly, neither cap charge nor TOI/G are perfect measures of player value, since each have a number of limitations and inconsistencies, but they provide a decent comparison and the results do vary somewhat.

A quick summary of the alternative metric:
  • TOI/G (through games played up to the All-Star break) replaces cap charge as the measure of value in the calculation
  • For goalies, TOI/G has been worked out as Total Minutes Played / Games Dressed For* - i.e. a goalie playing every minute of 75% of the games, zero in the rest, would end up with a TOI/G of 45 minutes (or close to it, once you factor in OT and so on).  [*Actually, "Games Played by Team - Games Missed by Goalie" - I'm not inclined to disentangle any three-goalie systems or minor-league conditioning stints.]
  • This arguably overstates the worth of starting goalies somewhat, but it's simple and you could equally argue that a workhorse goalie is the hardest position to replace, so it's fair for them to have a much higher TOI/G figure
  • Where a player hasn't played all year (several examples at this point of the season) or where a player fairly clearly has a reduced TOI/G figure due to getting injured in their only game or one of very few games, I've used TOI/G from last season (or further back if necessary)
  • For each player, multiply games missed by TOI/G to get (for a more palatable name) Cumulative Minutes of Injured Player (CMIP)
  • Take the aggregate of CMIP for the team and divide by games played by the team to arrive at AMIP (Average Minutes of Injured Players) - it feels more understandable expressing this metric as an average per game (whereas CHIP is a running total)
The figures...
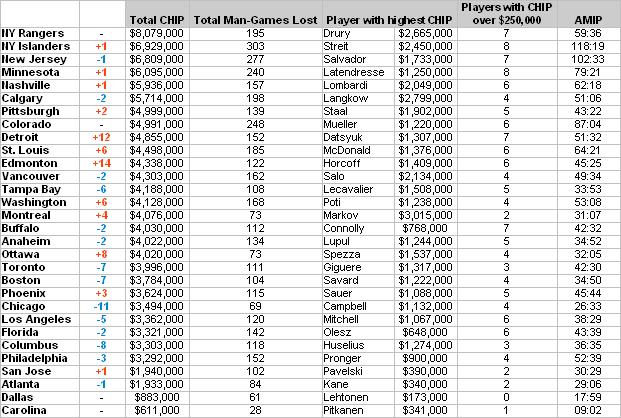
The table below shows:
  • Total CHIP for each team for the 2010/11 regular season (through games played up to the All-Star break)
  • The player who has contributed most to the team's CHIP figure
  • The number of players with a CHIP contribution of over $250,000 (think of it as being equivalent to a $1m player missing 20 games or a $4m player missing five games)
  • AMIP for each team over the same period (e.g. an AMIP of 40:00 could be seen as the team missing two 20-minute per game players for every game this season)

10 second analysis...
The Rangers' injury-fest continues, with Christensen, Girardi, Dubinsky, Fedotenko and Frolov all going down in January for varying lengths of time.  Of the bigger movers elsewhere in the table, Chicago's remaining big-ticket players have stayed healthy recently, while Detroit (Datsyuk, Cleary, Holmstrom, Stuart) and last year's #1 CHIP team, Edmonton (Hemsky, Horcoff, Whitney, Eberle) are moving in the other direction.

The next lists are the top 30 individual CHIP and CMIP contributions:


As could be expected, both lists are now starting to be dominated by players out all year, including some likely to remain out all year.  Chris Drury's clutch 10 minutes per game contributions since his return should help him slip down the CMIP list rather rapidly.

BONUS
Finally, another update of the crude injury-by-location analysis. Again, I’ve just used the descriptions found in the player profiles on tsn.ca, so the figures will encompass all the inaccuracies and vagueness within them. It should give a broad indication, if nothing else, though.


And as an extra, further final bonus, I introduce the Evasiveness Index.  This is basically the proportion of injury instances for each team that have been described as either "Undisclosed" or the helpfully pointless "Upper/Lower Body" in the same TSN profiles.  I have made no judgement about whether the many instances of "Illness" (i.e. concussion), "Flu" (i.e. concussion) or even "Boogaard Shoulder" (i.e. concussion) should also be included.

Arguably, we can see a weak correlation between the higher ratings and some of the smaller, southern markets with presumably less voraciously investigative media and fans, while two NY teams (OK, the Islanders perhaps a bad example...) and a cluster of Canadian teams are rated lower.

Clearly, a small sample size for Carolina so far, but a quick check back to last year shows the Rutherford/Maurice tag-team went a strong 23-for-37 then too (EI of 62.2), so maybe not just a freak number this year.


Notes/Disclaimers
  • Figures exclude a few minor-leaguers / marginal NHLers who are or had been on the NHL club’s IR since pre-season. Generally, if a minor-leaguer gets called up and then injured in an NHL game, his games missed will then count towards the CHIP though.  I've tried to exclude minor-league conditioning stints immediately after/during a period on IR from the man-games lost figures
  • There are undoubtedly a few inaccuracies and inconsistencies in there - I do the best I can with the information out there. Some corrections are picked up month-to-month too
  • The cap figure doesn't really correlate very well to the "worth" of a player in some cases, e.g. where rookie bonuses are included this year, where players are seeing out an old (underpaid or rookie) contract or where players are horrendously overpaid
  • Also, for any player who was acquired on re-entry waivers (e.g. Sean Avery), the cap hit will only reflect that for their current team, i.e. 50% of the player’s full cap hit (shared between his current and old teams)
  • I've once again stuck a full team-by-team listing of games missed and CHIP/CMIP numbers by each player on the web HERE
  • Injury/games/TOI info courtesy of tsn.ca and nhl.com - man-games lost info more than likely does not exactly match up with the "official" figures released by individual teams
  • Cap info courtesy of capgeek.com
9 January 2011

The Pain Game 2010/11 - Part Three

Injury stats update – December 2010

This is my third look for the 2010/11 regular season at which teams have been hit hardest by injuries by trying to place a value on the games missed by players due to injury/illness.  (Last month's analysis is HERE.)

The concept again - multiply each game missed by a player by his 2010/11 cap charge, then take the aggregate of these figures for each team and divide by 82. This indicator of value lost to a team by injury/illness is called CHIP (Cap Hit of Injured Players).

Alternatively...
Again, for a different indicator of player "value", I've also illustrated a similar metric based on TOI/G alongside the CHIP numbers.  Clearly, neither cap charge nor TOI/G are perfect measures of player value, since each have a number of limitations and inconsistencies, but they provide a decent comparison and the results do vary somewhat.

A quick summary of the alternative metric:
  • TOI/G (through games played on 31 December) replaces cap charge as the measure of value in the calculation
  • For goalies, TOI/G has been worked out as Total Minutes Played / Games Dressed For* - i.e. a goalie playing every minute of 75% of the games, zero in the rest, would end up with a TOI/G of 45 minutes (or close to it, once you factor in OT and so on).  [*Actually, "Games Played by Team - Games Missed by Goalie" - I'm not inclined to disentangle any three-goalie systems or minor-league conditioning stints.]
  • This arguably overstates the worth of starting goalies somewhat, but it's simple and you could equally argue that a workhorse goalie is the hardest position to replace, so it's fair for them to have a much higher TOI/G figure
  • Where a player hasn't played all year (several examples at this point of the season) or where a player fairly clearly has a reduced TOI/G figure due to getting injured in their only game or one of very few games, I've used TOI/G from last season (or further back if necessary)
  • For each player, multiply games missed by TOI/G to get (for a more palatable name) Cumulative Minutes of Injured Player (CMIP)
  • Take the aggregate of CMIP for the team and divide by games played by the team to arrive at AMIP (Average Minutes of Injured Players) - it feels more understandable expressing this metric as an average per game (whereas CHIP is a running total)
The figures...
The table below shows:

  • Total CHIP for each team for the 2010/11 regular season (through games played on 31 December)
  • The player who has contributed most to the team's CHIP figure
  • The number of players with a CHIP contribution of over $250,000 (think of it as being equivalent to a $1m player missing 20 games or a $4m player missing five games)
  • AMIP for each team over the same period (e.g. an AMIP of 40:00 could be seen as the team missing two 20-minute per game players for every game this season)

10 second analysis...
It's now a metro area sweep of the top three positions, thanks to a December upsurge in Islander absences (both on and off the ice, no doubt), including this year's first sighting of the very rare DP knee tweak.

The Rangers may well slip down the rankings once their captain finally returns to the ice.  Oh, it says here he played six games in December...strange that nobody noticed.

Conversely, the Devils players must be at increasing risk of injury from having to skate over the huge ruts in the ice directly between the goal crease and the players bench at Prudential Center that seemingly get worse after the first five minutes of every game.

The next lists are the top 30 individual CHIP and CMIP contributions:

So, I'm thinking using Michael Leighton's TOI/G from last year probably isn't quiiiite the best measure of the value of his absence to the Flyers, compared to his true current value of roughly minus zero.

BONUS
Finally, another update of the crude injury-by-location analysis. Again, I’ve just used the descriptions found in the player profiles on tsn.ca, so the figures will encompass all the inaccuracies and vagueness within them. It should give a broad indication, if nothing else, though.


Notes/Disclaimers
  • Figures exclude a few minor-leaguers / marginal NHLers who are or had been on the NHL club’s IR since pre-season. Generally, if a minor-leaguer gets called up and then injured in an NHL game, his games missed will then count towards the CHIP though.  I've tried to exclude minor-league conditioning stints immediately after/during a period on IR from the man-games lost figures
  • There are undoubtedly a few inaccuracies and inconsistencies in there - I do the best I can with the information out there. Some corrections are picked up month-to-month too
  • The cap figure doesn't really correlate very well to the "worth" of a player in some cases, e.g. where rookie bonuses are included this year, where players are seeing out an old (underpaid or rookie) contract or where players are horrendously overpaid
  • Also, for any player who was acquired on re-entry waivers (e.g. Sean Avery), the cap hit will only reflect that for their current team, i.e. 50% of the player’s full cap hit (shared between his current and old teams)
  • I've once again stuck a full team-by-team listing of games missed and CHIP/CMIP numbers by each player on the web HERE
  • Injury/games/TOI info courtesy of tsn.ca and nhl.com - man-games lost info more than likely does not exactly match up with the "official" figures released by individual teams
  • Cap info courtesy of capgeek.com

5 December 2010

The Pain Game 2010/11 - Part Two

Injury stats update – November 2010

This is my second look for the 2010/11 regular season at which teams have been hit hardest by injuries by trying to place a value on the games missed by players due to injury/illness.  (Last month's analysis is HERE.)

The concept again - multiply each game missed by a player by his 2010/11 cap charge, then take the aggregate of these figures for each team and divide by 82. This indicator of value lost to a team by injury/illness is called CHIP (Cap Hit of Injured Players).

Alternatively...
Again, for a different indicator of player "value", I've also illustrated a similar metric based on TOI/G alongside the CHIP numbers.  Clearly, neither cap charge nor TOI/G are perfect measures of player value, since each have a number of limitations and inconsistencies, but they provide a decent comparison and the results do vary somewhat.

A quick summary of the alternative metric:
  • TOI/G (through games played on 30 November) replaces cap charge as the measure of value in the calculation
  • For goalies, TOI/G has been worked out as Total Minutes Played / Games Dressed For* - i.e. a goalie playing every minute of 75% of the games, zero in the rest, would end up with a TOI/G of 45 minutes (or close to it, once you factor in OT and so on).  [*Actually, "Games Played by Team - Games Missed by Goalie" - I'm not inclined to disentangle any three-goalie systems or minor-league conditioning stints.]
  • This arguably overstates the worth of starting goalies somewhat, but it's simple and you could equally argue that a workhorse goalie is the hardest position to replace, so it's fair for them to have a much higher TOI/G figure
  • Where a player hasn't played all year (several examples at this point of the season) or where a player fairly clearly has a reduced TOI/G figure due to getting injured in their only game or one of very few games (e.g. Chris Drury), I've used TOI/G from last season (or further back if necessary)
  • For each player, multiply games missed by TOI/G to get (for a more palatable name) Cumulative Minutes of Injured Player (CMIP)
  • Take the aggregate of CMIP for the team and divide by games played by the team to arrive at AMIP (Average Minutes of Injured Players) - it feels more understandable expressing this metric as an average per game (whereas CHIP is a running total)
The figures...
The table below shows:

  • Total CHIP for each team for the 2010/11 regular season (through games played on 30 November)
  • The player who has contributed most to the team's CHIP figure
  • The number of players with a CHIP contribution of over $250,000 (think of it as being equivalent to a $1m player missing 20 games or a $4m player missing five games)
  • AMIP for each team over the same period (e.g. an AMIP of 40:00 could be seen as the team missing two 20-minute per game players for every game this season)

10 second analysis...
The Rangers continue to surge way past the CHIP numbers they recorded the last two years.  Has the absence of Chris Drury's clutch face-off wins and shot blocking really been the devastating loss that the numbers here suggest?  In a word: You must be kidding.

The Devils have not seemingly coped well with the absence of a handful of players during games this year.  Puzzling, given there are normally around 10,000 men missing from most of their games, so you'd think they were used to it.

Colorado's figures suggest they must have faced an epidemic of injuries to minor league defensemen and are not paying Craig Anderson enough

The next lists are the top 30 individual CHIP and CMIP contributions:

As Captain Clutch is apparently not too far away from a return from the NHL's longest ever finger-related absence (at least until a certain Leafs D-man completes a few more weeks in the minors), expect long-term absentees Langkow and Markov to lead the way soon.

BONUS
Finally, another update of the crude injury-by-location analysis. Again, I’ve just used the descriptions found in the player profiles on tsn.ca, so the figures will encompass all the inaccuracies and vagueness within them. It should give a broad indication, if nothing else, though.


Notes/Disclaimers
  • Figures exclude a few minor-leaguers / marginal NHLers (Ryan Stone?) who are or had been on the NHL club’s IR since pre-season. Generally, if a minor-leaguer gets called up and then injured in an NHL game, his games missed will then count towards the CHIP though.
  • There are undoubtedly a few inaccuracies and inconsistencies in there - I do the best I can with the information out there. Some corrections are picked up month-to-month too
  • The cap figure doesn't really correlate very well to the "worth" of a player in some cases, e.g. where rookie bonuses are included this year, where players are seeing out an old (underpaid or rookie) contract or where players are horrendously overpaid
  • Also, for any player who was acquired on re-entry waivers (e.g. Sean Avery), the cap hit will only reflect that for their current team, i.e. 50% of the player’s full cap hit (shared between his current and old teams)
  • I've once again stuck a full team-by-team listing of games missed and CHIP/CMIP numbers by each player on the web HERE
  • Injury/games/TOI info courtesy of tsn.ca and nhl.com - man-games lost info more than likely does not exactly match up with the "official" figures released by individual teams
  • Cap info courtesy of capgeek.com

17 November 2010

NHL Road Trip 2010

*Technically, featuring no roads

A few brief observations from each of the games I attended while on the wrong side of the Atlantic recently. Written at the time (or close enough), explaining any tense tension.

Game #1: Chicago Blackhawks 2-3 New York Rangers
  • I'm sat a few rows behind a group of Swedish-looking people wearing matching red "I ♥ Hjalmarsson" T-shirts. Stockholm branch of the Jason Pominville fan club on vacation?
  • Generally seems to be a fair few more Hawks fans than were at MSG for the same matchup two years ago. Hmm, why could that be?
  • Tomáš Kopecký scores to give however many Slovakian fans might be in attendance something to savour, since the two Marians are both on the shelf
  • As is ritual, the guy doing the intermission puck shooting contest gets a special MSG boo each time he misses the target
  • Duncan Keith apparently played 27:23, but it seemed more like 57:23
  • Odds on a Ryan Callahan jersey purchase have dropped further still
  • Why can't the Rangers play like this more often? Pretty damn solid defensively, some timely scoring and Lundqvist making big saves when needed (I'll excuse him a soft looking second goal)
  • Duuuuuuuuuuuubbbbbbbbbiiiiiiiii
Game #2: New York Rangers 1-4 Philadelphia Flyers
  • On the main concourse, former NHL ref Kerry Fraser is signing copies of his new book. A fairly healthy line suggests that Flyers fans are generally prepared to spend an extra $29.95 to abuse an official from closer range than normal
  • Some fairly obvious yapping between Carcillo, Avery and Boogaard during warm-ups. Carcillo in particular appears to eschew any involvement with the pucks on the ice the whole time, preferring to skate repeatedly along the red line past the two Rangers, even long after they give up paying attention
  • The Flyers' PA announcer still has a voice that makes me want to slice my ears off with a blunt spoon
  • Parents of ginger-haired children in the Philadelphia area: Your kids will have things difficult enough. You should really buy them the road white jersey instead.
  • Jeff Carter's work ethic and ability to avoid cheap penalties are questioned by more than a few home fans in my section
  • Unusual first intermission entertainment, as we get to watch ex-Flyer and celebrity moustache, Bill Clement, officially become a US citizen (despite messing up one of the oaths). Not entirely sure what I'm supposed to do with myself when the crowd is then asked to rise and join in a recital of the Pledge of Allegiance
  • Fairly ridiculous pass from Claude Giroux to Mike Richards on the Flyers' first goal
  • Despite rarely getting tested, Sergei Bobrovsky receives rapturous applause for even the most basic 50-foot wrister at his chest. Maybe the fans really aren't used to seeing such things...
  • Carcillo with a dangerously cheap headshot? Really? I'm shocked. Shocked!
  • The officials completely missing/ignoring said dangerously cheap headshot? Really? I'm shocked. Shocked!
  • Generally a fairly even game until the Rangers opt to aim both barrels at their lower extremities to make it 3-1 - Michael Del Zotto with a horrendous giveaway in front of his net for Blair Betts to score; Henrik Lundqvist somehow deflecting a Nik Zherdev shot taken from the corner of a rink somewhere in Delaware into his own net
  • The Rangers missed Marián Gáborík more than other recent games - some decent work down low, but hardly any good scoring chances created and practically nothing off the rush
  • Maybe finally inserting Alex Frolov into the line-up after missing the first 12 games will inject some offense. Oh, wait a sec...
Game #3: New York Rangers 3-0 New Jersey Devils
  • Perhaps not the most salubrious surroundings and it's never close to being full, but Prudential Center is a really nice building
  • Lots of Rangers fans in the house as normal. Personal welcomes limited to one old guy muttering "scum" under his breath as I walked past. Slightly disappointing lack of commitment to the insult there...
  • A lot of injury absences on both sides (most notably, Gáborík, Callahan, Captain Clutch for the Rangers; Brodeur and Parise for the Devils). Olivier Magnan-Grenier's appearance in the Devils' starting line-up produces a "Who the hell is that?" comment from a Devils fan behind me
  • Not a whole lot to report from the game, as it's mostly pretty (s)crappy throughout. The second period is perhaps the most poorly played 20 minutes of NHL hockey I've seen in person
  • The man Duuuuuuubbbbbbbbbiiiiiiii is on fire - Stamkos Schmamkos...
  • Hello, Ilya Kovalchuk? You there? Still, not all his fault or that of Uncle Lou - a lot of the blame needs to go to the Devils' owner (who is, of course, Henrik Lundqvist)
  • Always a satisfying win, but it doesn't feel the same without a Maaaarrrrrrtttttyyyyyy chant
Game #4: St. Louis Blues 2-0 New York Rangers
  • A real buzz in the building as everyone anticipates the much-hyped, marquee goalie match-up of...er, Ty Conklin versus Marty Biron
  • If you like having people walk across your line of sight repeatedly, including vendors carrying large objects above head height, then try and get tickets two rows back from the internal concourse at MSG. (Alternatively, just watch a Red Wings home game on TV.)
  • Beer Pong has a strong first period to keep the game goalless, as the Blues dictate most of the play
  • A break - aided by the fleet-footed Derek Boogaard stranding himself in the offensive zone looking for a pointless hit - sees Alex Steen open the scoring early in the second
  • From that point, the Blues sit back and watch the Rangers painfully flounder for the rest of the game
  • I was hoping for a disallowed goal from the Blues' #64, so I could say it was nixed as Nikita Nikitin kicked it in, but no joy...
  • The only serious threat comes from a five-minute powerplay in the third period after B.J. Crombeen tries to decorate the boards with the contents of Derek Stepan's skull. The "threat" mainly one of being deafened by the booing of the practically impotent Rangers PP
  • My view of the empty-netter is blocked by a few hundred people leaving - not that I care by that point. A pretty rancid game all round
Game #5: Washington Capitals 5-3 New York Rangers
  • A smattering of Caps fans / Ovechkin fanboys in evidence during warmups - including one confused kid wearing a Caps jersey and Rangers hat
  • The guest anthem singer is apparently the former frontman of Barenaked Ladies - US/Canadian diplomatic relations become strained as he botches the lyrics
  • A fast, physical start as Ryan Callahan dumps Semin in the corner
  • Brandon Dubinsky and Mike Green discard helmets and square off - more grabbing than punching going on though. Smart move by Green to take the more talented, dangerous offensive threat off for five minutes...
  • Despite the 24/7 efforts of some of the finest minds in the hockey world, nobody has yet found a way of stopping Brian Boyle scoring goals
  • John Erskine is revealed as tonight's winner of the "Player Who Never Scores Or Is In A Horrendous Slump Until He Plays The Rangers" Lottery
  • That is soon surpassed by the frankly astonishing sight of Derek Boogaard channeling his inner Pavel Bure, as he blazes a path down the left wing (slight exaggeration) before unleashing a laser of a slapshot (no exaggeration) over Michal Neuvirth's shoulder - I struggle to surpress laughter for the rest of the period
  • Despite playing much better than the last few games and containing the Caps reasonably well over the last 40 minutes, the crushingly inevitable tie-breaking goal from a fourth line scrub, followed by the crushingly inevitable total inability to control the puck with the goalie pulled kills off the Rangers
Game #6: Buffalo Sabres 5-4 (SO) New Jersey Devils
  • Despite spending most of the day in bed or on the toilet and feeling like I've lost about 10lbs in five hours (the "Reverse Brodeur"), the lure of seeing two bad teams that I don't support proves too much, so I make the late decision to head out
  • Surprising to see the box office lobby so full of people. Is it Tommy Albelin's jersey retirement tonight? Ken Daneyko's TV make-up crew having a meeting? Whatever it is, precisely one other person is actually there to buy a ticket, which makes more sense
  • More backup goalie dueling tonight - Enroth and Hedberg are filling in for the injured Miller and Brodeur respectively
  • My section is jam packed with annoying fans tonight:
    1. Your typical sports radio idiot sat right behind me. He yaps away constantly (sample: "I hate all Canadians except one. Spezza. And Rick Nash.") and is well on pace to smash the records for most instances of saying "Just shoot the puck!" and calling Mattias Tedenby "Tanabe", until he is moved on by someone actually having tickets to sit there
    2. His replacement is a kid unfortunately prone to greeting any routine clear or two foot pass with an exclamation you would perhaps hear had Marv Albert starred in "When Harry Met Sally" and smoked 100 a day from birth
    3. A Sabres fan rhetorically asking why Drew Stafford (#21, right-hand shot, not playing due to injury) was still in the NHL every time Rob Niedermayer (#20, left-hand shot, actually playing tonight) touched the puck. For the whole game.
  • I'd like to be able to describe the first two Sabres goals, but I was too busy projectile vomiting a bottle of orange juice across the nearest bathroom floor. Should be more embarrassed by that than I really am...
  • Having regained control of my stomach, I get to see four more second period goals as the Sabres and Devils both do a pretty good impression of teams with bad defense, which (against type and reputation) they actually seem to be
  • After the Sabres tie it up again in the third, they have most of the chances the rest of the way with Hedberg somewhat fortunately surviving several scrambles in his crease
  • His confidence up after missing the net by roughly 30 feet on a partial breakaway late in the third, Ilya Kovalchuk then caps off the shootout in sudden death by amusingly flubbing the puck slowly into the corner
Game #7: Buffalo Sabres 2-3 (OT) New York Rangers
  • Just because I haven't seen enough backup goalies this trip, Henrik Lundqvist is a late flu victim (late pull out rather than it being fatal...) so Marty Biron gets another MSG start. Lundqvist not even in warmups, but he'll have to be on the bench
  • The returning Marián Gáborík gets crunched into the boards on an early shift. I (and probably most of MSG) ignore the rest of the shift to instead see if he's hurt on his return to the bench - he seems OK
  • Rob Niedermayer misses on a breakaway as he exits the penalty box - further proof, if it were needed, that Drew Stafford does not belong in the NHL
  • After a shaky looking first period from Jhonas Enroth in the Sabres goal, the Rangers take advantage by pummeling him with four shots in the second, which ends tied at two as the Rangers obligingly let Mike Grier stand in the crease untouched to score with 2.9 seconds left
  • I even manage to watch the whole second period without painting the floor of an MSG bathroom vivid orange
  • The crowd becomes mildly incensed when Ruslan Fedotenko has a goal chalked off in an "intent to blow" scenario. Especially odd for a quick whistle (at least an intended one) to come when two earlier goals came from similar situations that were allowed to play out
  • Things look bleak for the Rangers when Brian Boyle takes a penalty with six minutes left shortly after yet another PP failure - a circumstance that has not produced favourable results on roughly 300 other occasions this year already. However, the PK holds firm
  • Alex Frolov's third period contribution includes another slam dunk chance missed from right in front of goal and a sensible decision to ice the puck late in the game rather than take two strides in open ice to reach the red line first
  • In OT, a Vanek/Roy 2-on-1 is survived by the Rangers (not the first such mess up by Vanek the last two nights) before Artem Anisimov secures the two points with his second goal of the game
All in all, a satisfying end to the trip and another strong showing by Beer Pong, which hopefully earns Lundqvist the lighter workload this year that the Rangers are looking for. A 3-3 record for the Rangers in my presence, just about maintaining my streak of non-losing records (19-9-1 overall for those scoring at home...)

4 November 2010

The Pain Game 2010/11 - Part One

Injury stats update – October 2010

This is my first look for the 2010/11 regular season at which teams have been hit hardest by injuries by trying to place a value on the games missed by players due to injury/illness.

[For more up-to-date analysis, look HERE.]

The concept again - multiply each game missed by a player by his 2010/11 cap charge, then take the aggregate of these figures for each team and divide by 82. This indicator of value lost to a team by injury/illness is called CHIP (Cap Hit of Injured Players).

Alternatively...
Again, for a different indicator of player "value", I've also illustrated a similar metric based on TOI/G alongside the CHIP numbers.  Clearly, neither cap charge nor TOI/G are perfect measures of player value, since each have a number of limitations and inconsistencies, but they provide a decent comparison and the results do vary somewhat.

A quick summary of the alternative metric:
  • TOI/G (through games played on 1 November) replaces cap charge as the measure of value in the calculation
  • For goalies, TOI/G has been worked out as Total Minutes Played / Games Dressed For - i.e. a goalie playing every minute of 75% of the games, zero in the rest, would end up with a TOI/G of 45 minutes (or close to it, once you factor in OT and so on)
  • This arguably overstates the worth of starting goalies somewhat, but it's simple and you could equally argue that a workhorse goalie is the hardest position to replace, so it's fair for them to have a much higher TOI/G figure
  • Where a player hasn't played all year (several examples at this point of the season) or where a player fairly clearly has a reduced TOI/G figure due to getting injured in their only game or one of very few games (e.g. Chris Drury), I've used TOI/G from last season (or further back if necessary)
  • For each player, multiply games missed by TOI/G to get (for a more palatable name) Cumulative Minutes of Injured Player (CMIP)
  • Take the aggregate of CMIP for the team and divide by games played by the team to arrive at AMIP (Average Minutes of Injured Players) - it feels more understandable expressing this metric as an average per game (whereas CHIP is a running total)
The figures...
The table below shows:
  • Total CHIP for each team for the 2010/11 regular season (through games played on 1 November)
  • The player who has contributed most to the team's CHIP figure
  • The number of players with a CHIP contribution of over $250,000 (think of it as being equivalent to a $1m player missing 20 games or a $4m player missing five games)
  • AMIP for each team over the same period (e.g. an AMIP of 40:00 could be seen as the team missing two 20-minute per game players for every game this season) [Editor's note: At least it would if I'd remembered to include it...]

10 second analysis...
Pretty striking that the Rangers are already approaching $2m in CHIP when you consider that their totals for the entire season in 2008/09 and 2009/10 were $1.3m and $2.5m respectively. This is largely due to the long-awaited semi-serious Gaborik injury and Drury's double-clutch finger breakage.

Brian Campbell's almost singlehanded contribution to Chicago's CHIP total (helped by the Hawks' relatively busy schedule in October) bears comparison to some of the much lower CHIP totals for teams also with around 20 man-games lost.

The three games missed by minute-munching Jamal Mayers may have irretrieveably derailed the Sharks' season already.

The next lists are the top 30 individual CHIP and CMIP contributions:


Again, the AMIP figures perhaps inflate the worth of goalies somewhat. The Flyers and Senators have certainly shown they can find even more mediocre-to-poor goaltending pretty easily whenever injury hits the incumbent.

BONUS
Finally, another update of the crude injury-by-location analysis. Again, I’ve just used the descriptions found in the player profiles on tsn.ca, so the figures will encompass all the inaccuracies and vagueness within them. It should give a broad indication, if nothing else, though.


Notes/Disclaimers
  • Figures exclude a few minor-leaguers / marginal NHLers (Ryan Stone?) who are or had been on the NHL club’s IR since pre-season. Generally, if a minor-leaguer gets called up and then injured in an NHL game, his games missed will then count towards the CHIP though.
  • There are undoubtedly a few inaccuracies and inconsistencies in there - I do the best I can with the information out there. Some corrections are picked up month-to-month too
  • The cap figure doesn't really correlate very well to the "worth" of a player in some cases, e.g. where rookie bonuses are included this year, where players are seeing out an old (underpaid or rookie) contract or where players are horrendously overpaid
  • Also, for any player who was acquired on re-entry waivers (e.g. Sean Avery), the cap hit will only reflect that for their current team, i.e. 50% of the player’s full cap hit (shared between his current and old teams)
  • I've once again stuck a full team-by-team listing of games missed and CHIP/CMIP numbers by each player on the web HERE
  • Injury/games/TOI info courtesy of tsn.ca and nhl.com - man-games lost info more than likely does not exactly match up with the "official" figures released by individual teams
  • Cap info courtesy of capgeek.com