22 November 2013

NHL man-games lost and CHIP analysis - 20-game report

This is my second look for the 2013/14 regular season looking at which teams have been hit hardest by injuries by trying to place a value on the games missed by players due to injury/illness. 

The concept again - multiply each game missed by a player by his 2013/14 cap charge (including bonuses), then take the aggregate of these figures for each team and divide by 82. This indicator of value lost to a team by injury/illness is called CHIP (Cap Hit of Injured Players).

This analysis covers every team up to its 20th game. (Amazingly, this follows on from my 10-game analysis.)

For a more regular snapshot, CHIP rankings are also being fed into Rob Vollman's Team Luck calculator on a weekly basis and I'll do my best to put out the same info via the medium known to Randy Carlyle as "that Wheatie machine or whatever" (@LW3H).

Alternatively...
Again, for a different indicator of player "value", I've also illustrated a similar metric based on TOI/G alongside the CHIP numbers.  Clearly, neither cap charge nor TOI/G are perfect measures of player value, since each have a number of limitations and inconsistencies, but they provide a decent comparison and the results do vary somewhat.

A quick summary of the alternative metric:
  • TOI/G replaces cap charge as the measure of value in the calculation
  • For goalies, TOI/G has been worked out as Total Minutes Played / Games Dressed For* - i.e. a goalie playing every minute of 75% of the games, zero in the rest, would end up with a TOI/G of 45 minutes (or close to it, once you factor in OT and so on).  [*Actually, "Games Played by Team - Games Missed by Goalie" - I'm not inclined to disentangle any three-goalie systems or minor-league conditioning stints.]
  • This arguably overstates the worth of starting goalies somewhat, but it's simple and you could equally argue that a workhorse goalie is the hardest position to replace, so it's fair for them to have a much higher TOI/G figure
  • Where a player hasn't played all year or where a player fairly clearly has a reduced TOI/G figure due to getting injured in their only game or one of very few games, I've used TOI/G from last season (or further back if necessary)
  • For each player, multiply games missed by TOI/G to get (for a more palatable name) Cumulative Minutes of Injured Player (CMIP)
  • Take the aggregate of CMIP for the team and divide by games played by the team to arrive at AMIP (Average Minutes of Injured Players) - it feels more understandable expressing this metric as an average per game (whereas CHIP is a running total)
The figures...
The table below shows:
  • Total CHIP for each team over the first 20 games of the regular season, as well as the distribution of CHIP by position
  • The player who has contributed most to the team's CHIP figure
  • The number of players with a CHIP contribution of over $250,000 (think of it as being equivalent to a $1m player missing 20 games or a $4m player missing five games)
  • AMIP for each team over the same period (e.g. an AMIP of 40:00 could be seen as the team missing two 20-minute per game players for every game this season) 

The following is a ranking of teams by CHIP over Games 11-20 only, to further illustrate some of the biggest movers since last time:


10 second analysis...
  • The Central isn't injury central
  • Boston, Philadelphia and (to a lesser extent) Tampa Bay have been much healthier than it would appear if you deduct the totals from their pseudo-retired players (see below)
  • San Jose lead the way in Burns injuries
  • Ottawa will presumably start injuring their own players, if they run any sort of points-to-injury correlation analysis covering last season and this season only
  • Among Buffalo's throng of fringe NHLers/borderline AHLers/Grigorenkos, I had originally excluded Corey Tropp's (eventual 15-game) absence from their numbers, but have now included it since he played games 16-20

The next lists are the top 30 individual CHIP and CMIP contributions:

The CMIP table is goalie heavy (insert Brodeur gag here) as is usually the case.  Carolina with four of the top 17 CHIP numbers, giving opposition team announcers something to talk about in the 30 seconds they have to spare between "Look! Two brothers on the same team!" conversation.

Where does it hurt?
This is another update of the crude injury-by-location analysis. Again, I’ve just used the descriptions found in the player profiles on tsn.ca, so the figures will encompass all the inaccuracies and vagueness within them. It should give a broad indication, if nothing else, though.

 
An impressive early season showing for UBI/LBI cases, which only (?) made up 22% of the injury instances last season.  As more players have come back from injuries pre-dating the season starting, the crude rate of injuries (instances / total games played) has drifted down from 0.91 to 0.86, compared to 0.80 per game last year (0.78 in 2011/12 and 0.76 in 2010/11).

Finally, a look at the Evasiveness Index.  This is basically the proportion of injury instances for each team that have been described as either "Undisclosed" or the helpfully pointless "Upper/Lower Body" in the same TSN profiles.  I have made no judgement about whether the many instances of "Illness" (i.e. concussion), "Flu" (i.e. concussion) should also be included.


Phoenix and Carolina no strangers to the top of this table, Edmonton and Colorado no strangers to the other end.

Notes/Disclaimers
  • Figures exclude a few minor-leaguers / marginal NHLers (usually an arbitrary judgement on my part) who had been on the NHL club’s IR since pre-season. Generally, if a minor-leaguer gets called up and then injured in an NHL game, his games missed will then count towards the CHIP though.  Minor-league conditioning stints immediately after/during a period on IR might be included in the man-games lost figures (but can't guarantee I get it right every time)
  • For the avoidance of doubt, suspensions and absences due to "personal reasons" are not included in the figures.  However, as per previous seasons, any "retired" player still under contract (Savard, Pronger, Ohlund) is still included.
  • There are undoubtedly a few inaccuracies and inconsistencies in there - I do the best I can with the information out there. Corrections might well be picked up in subsequent updates
  • The cap figure obviously doesn't really correlate very well to the "worth" of a player in some cases, e.g. where players are seeing out an old (underpaid or rookie) contract or where players are horrendously overpaid and/or were signed by Paul Holmgren
  • Also, for any player traded where cap hit is retained by his old team, the cap hit used will only reflect that for his current team.
  • I've once again stuck a full team-by-team listing of games missed and CHIP/CMIP numbers by each player on the web HERE
  • Injury/games/TOI info courtesy of tsn.ca and nhl.com - man-games lost info more than likely does not exactly match up with the "official" figures released by individual teams
  • Cap info courtesy of capgeek.com

2 November 2013

NHL man-games lost and CHIP analysis - 10-game report

This is my first look for the 2013/14 regular season looking at which teams have been hit hardest by injuries by trying to place a value on the games missed by players due to injury/illness.

The concept again - multiply each game missed by a player by his 2013/14 cap charge (including bonuses), then take the aggregate of these figures for each team and divide by 82. This indicator of value lost to a team by injury/illness is called CHIP (Cap Hit of Injured Players).

All being well, I'll be cutting the season into 10-game chunks for ease of comparability.  So this analysis covers every team up to its 10th game.  Blame the St. Louis Blues for being the last team to get there.

For a more regular snapshot, CHIP rankings are being fed into Rob Vollman's world-famous, Puck Daddy commenter approved, Team Luck calculator.  So go there, people.

Alternatively...
Again, for a different indicator of player "value", I've also illustrated a similar metric based on TOI/G alongside the CHIP numbers.  Clearly, neither cap charge nor TOI/G are perfect measures of player value, since each have a number of limitations and inconsistencies, but they provide a decent comparison and the results do vary somewhat.

A quick summary of the alternative metric:
  • TOI/G replaces cap charge as the measure of value in the calculation
  • For goalies, TOI/G has been worked out as Total Minutes Played / Games Dressed For* - i.e. a goalie playing every minute of 75% of the games, zero in the rest, would end up with a TOI/G of 45 minutes (or close to it, once you factor in OT and so on).  [*Actually, "Games Played by Team - Games Missed by Goalie" - I'm not inclined to disentangle any three-goalie systems or minor-league conditioning stints.]
  • This arguably overstates the worth of starting goalies somewhat, but it's simple and you could equally argue that a workhorse goalie is the hardest position to replace, so it's fair for them to have a much higher TOI/G figure
  • Where a player hasn't played all year or where a player fairly clearly has a reduced TOI/G figure due to getting injured in their only game or one of very few games, I've used TOI/G from last season (or further back if necessary)
  • For each player, multiply games missed by TOI/G to get (for a more palatable name) Cumulative Minutes of Injured Player (CMIP)
  • Take the aggregate of CMIP for the team and divide by games played by the team to arrive at AMIP (Average Minutes of Injured Players) - it feels more understandable expressing this metric as an average per game (whereas CHIP is a running total)
The figures...
The table below shows:
  • Total CHIP for each team over the first 10 games of the regular season, as well as the distribution of CHIP by position
  • The player who has contributed most to the team's CHIP figure
  • The number of players with a CHIP contribution of over $250,000 (think of it as being equivalent to a $1m player missing 20 games or a $4m player missing five games)
  • AMIP for each team over the same period (e.g. an AMIP of 40:00 could be seen as the team missing two 20-minute per game players for every game this season) 
10 second analysis...
The Sharks have obviously struggled badly without Marty Havlát, Raffi Torres, Adam Burish and Tomáš Hertl's sense of respect and dignity.  Meanwhile, the Kings, Blackhawks and Blues are demonstrating that they don't have enough grit and toughness to play in the gritty, tough areas needed to be successful.

The next lists are the top 30 individual CHIP and CMIP contributions:

Rick Nash aside, most of the CHIP leaders have been out all for all 10 games, which Nash tells me is "good".

Where does it hurt?
This is another update of the crude injury-by-location analysis. Again, I’ve just used the descriptions found in the player profiles on tsn.ca, so the figures will encompass all the inaccuracies and vagueness within them. It should give a broad indication, if nothing else, though.

 
Clearly very early days (and no attempt made to adjust for injuries pre-dating the season starting), but the crude rate of injuries (instances / total games played) stands at 0.91, compared to 0.80 per game last year (0.78 in 2011/12 and 0.76 in 2010/11).

Notes/Disclaimers
  • Figures exclude a few minor-leaguers / marginal NHLers (usually an arbitrary judgement on my part) who had been on the NHL club’s IR since pre-season. Generally, if a minor-leaguer gets called up and then injured in an NHL game, his games missed will then count towards the CHIP though.  Minor-league conditioning stints immediately after/during a period on IR might be included in the man-games lost figures (but can't guarantee I get it right every time)
  • For the avoidance of doubt, suspensions and absences due to "personal reasons" are not included in the figures.  However, as per previous seasons, any "retired" player still under contract (Savard, Pronger, Ohlund) is still included.
  • There are undoubtedly a few inaccuracies and inconsistencies in there - I do the best I can with the information out there. Corrections might well be picked up in subsequent updates
  • The cap figure obviously doesn't really correlate very well to the "worth" of a player in some cases, e.g. where players are seeing out an old (underpaid or rookie) contract or where players are horrendously overpaid and/or were signed by Paul Holmgren
  • Also, for any player traded where cap hit is retained by his old team, the cap hit used will only reflect that for his current team.
  • I've once again stuck a full team-by-team listing of games missed and CHIP/CMIP numbers by each player on the web HERE
  • Injury/games/TOI info courtesy of tsn.ca and nhl.com - man-games lost info more than likely does not exactly match up with the "official" figures released by individual teams
  • Cap info courtesy of capgeek.com

13 September 2013

The Pain Game 2013 - per-game breakdown (East)

Having already looked at the Western Conference, below is a graphical breakdown of man-games lost to injury/illness (MGL) and the corresponding cap-hit of each injured player (CHIP) across the entire 2013 (ir)regular season for each team in the Eastern Conference as was, along with the team's rolling/cumulative Fenwick 5v5 close.

See the link above for a marginally more comprehensive explanation.

Data sourced from extraskater.com and tsn.ca.

[Click to enlarge charts]

Boston Bruins (season aggregates - MGL: 101, CHIP: $4,252k)


Basically healthy over the first half (excluding the Savardian baseline), before a handful of injuries over the second. The dip in possession numbers over Games 36-41 does neatly coincide with Patrice Bergeron's absence.

Buffalo Sabres (MGL: 132, CHIP: $5,176k)


Game 28's OT loss to the Senators clearly the high point of the season.

Carolina Hurricanes (MGL: 167, CHIP: $6,897k) 


A generally decent possession team, enough blue ink on the right-hand side of the chart to paint "Cam Ward is our only NHL goalie" in 10-foot high letters on the side of their building.

Florida Panthers (MGL: 325, CHIP: $10,136k) 


More of a struggle over the last 10 games or so, when presumably a better quality group of overpaid third liners was out compared to the group of overpaid third liners that was out over the previous 20 games.

Montreal Canadiens (MGL: 132, CHIP: $2,654k) 


Another team pretty much healthy over most of the first half of the season, although heroically overcoming the devastating absence of Tomas Kaberle in Game 4.

New Jersey Devils (MGL: 91, CHIP: $3,641k) 


The enormous rising levels of red ink will surely begin to subside over the next season.

New York Islanders (MGL: 85, CHIP: $1,059k) 


Freakishly, the blue bars are also a near-perfect representation of the cost of the DiPietro buyout over the next 48 years.

New York Rangers (MGL: 140, CHIP: $3,708k) 


Who was injured when?  None of your damn business.  Next question.

Ottawa Senators (MGL: 229, CHIP: $10,055k) 


Very injury-hit all season, but the middle stretch particularly notable - the heaviest patch of injuries, declining possession numbers, #1 goalie out, but still relatively successful.

Philadelphia Flyers (MGL: 312, CHIP: $10,239k) 


All injury numbers subject to Pronger-inflation, but a noticeable second-half swoon/towel-throwing, in particular everyone associated with the team struggling to cope without Zac Rinaldo over the last 12 games.

Pittsburgh Penguins (MGL: 79, CHIP: $5,399k) 


Whereas the absence of possession sink-hole Sidney Crosby over the Penguins' last 12 games had no noticeable effect whatsoever.

Tampa Bay Lightning (MGL: 152, CHIP: $5,468k) 


I might have actually used the team save percentage for the red line here, on closer inspection...

Toronto Maple Leafs (MGL: 92, CHIP: $2,763k) 


A lot of gritty play causing some injuries over the first half, then a lot of gritty play to protect their teammates, play through injury and/or a significant reduction in helmet heat over the second half.

Washington Capitals (MGL: 153, CHIP: $5,173k) 


Who knows how much more successful the Capitals could have been had Tom Poti not been healthy for half the season?

Winnipeg Jets (MGL: 180, CHIP: $4,177k) 


The likelihood of injuries presumably increased by the many extra miles logged due to the Jets' brutal travel schedule in the Southeast Division and the need to walk around Dustin Byfuglien to get out of the dressing room.

3 September 2013

The Pain Game 2013 - per-game breakdown (West)

Having seen one or two examples of trends in team performance being illustrated by charts of possession-proxy metrics at a game-by-game level (examples below), I figured I could attempt to show injury statistics in a similar way, restrospectively at least - it remains to be seen whether tracking the numbers on such a frequent basis for the upcoming season is a viable prospect or a Hugh Jessiman.


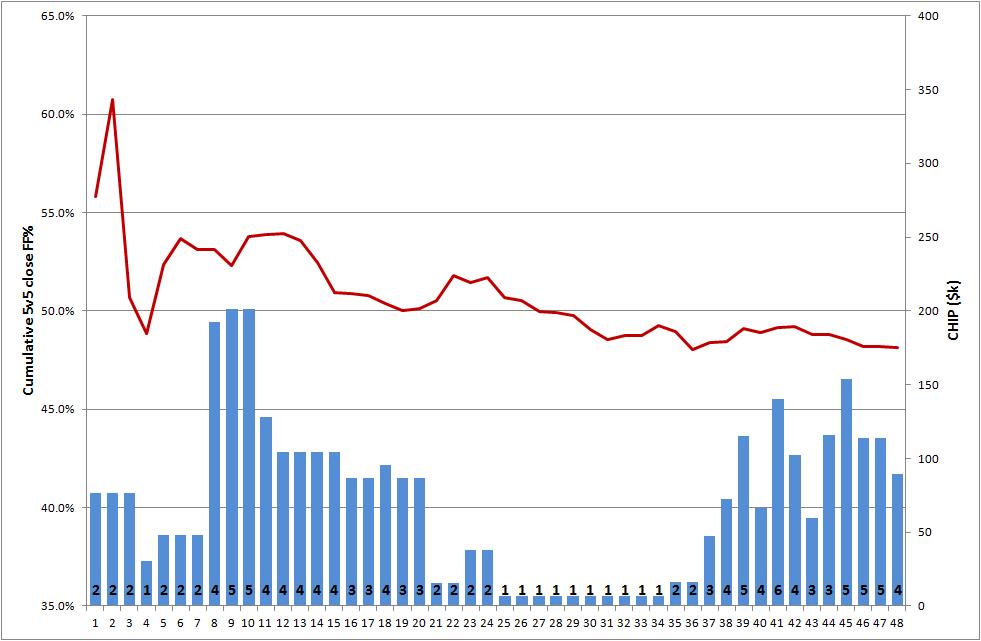
So, what follows is a breakdown of man-games lost to injury/illness (MGL) and the corresponding cap-hit of each injured player (CHIP) across the entire 2013 (ir)regular season for what was once known as the Western Conference.  Hopefully self-evident, but if not, the figure inside the x-axis is the MGL for each game (i.e. number of players missing), the blue bar is CHIP for the game ($k against the right-hand axis).

I've also added the rolling/cumulative Fenwick 5v5 close (red line against the left-hand axis), if only for a broad indication of team performance trends.  Definitely not wise to place too much emphasis on the comparison between injury absences and performances, especially at an individual game level - clearly, many other factors come into play - but it adds a bit of context.  For the avoidance of doubt, absences not due to injury/illness (e.g. healthy scratches, suspensions) are not captured here and who is or isn't included in the numbers is subject to the psuedo-abitrary rulings I normally apply throughout the year.

Data sourced from extraskater.com and tsn.ca.

[Click to enlarge charts]

Anaheim Ducks (season aggregates - MGL: 70, CHIP: $1,660k)


Not much going on here, for what was a largely healthy Ducks team.

Calgary Flames (MGL: 136, CHIP: $3,383k)


The CHIP spike for Games 8-20 mostly due to Miikka Kiprusoff's absence, which obviously shouldn't feed through to possession numbers anyway.  Nice to see that the tanking/awfulness from the midpoint flourished regardless of the degree of health.


Chicago Blackhawks (MGL: 98, CHIP: $3,852k)


As you would expect, the domination of the Hawks only really got going once Dan Carcillo became available to be healthy scratched from Game 17 on.

Colorado Avalanche (MGL: 154, CHIP: $5,467k)


Well, the first few games were enjoyable...

Columbus Blue Jackets (MGL: 137, CHIP: $4,166k) 


As you would expect, the return to relative health of the Jackets only really got going once Marian Gaborik joined the roster from Game 37 on.

Dallas Stars (MGL: 93, CHIP: $2,611k) 


See Calgary's second half, only without the injuries.

Detroit Red Wings (MGL: 247, CHIP: $6,966k) 


A possibly misleading uptick over the last dozen games, unless you really think Kyle Quincey's return to the line-up was that important.

Edmonton Oilers (MGL: 217, CHIP: $5,689k) 


The absence of the vital attributes supplied by Ryan Jones, Ben Eager and Theo Peckham missing over the early stretch simply torpedoed the Oilers' season.

Los Angeles Kings (MGL: 103, CHIP: $3,900) 


Good team.  Willie Mitchell and Matt Greene injured.  Fin.

Minnesota Wild (MGL: 91, CHIP: $2,804k) 


Another generally healthy team until the late absences of former goalscorers Dany Heatley, Mike Rupp and Zenon Konopka.

Nashville Predators (MGL: 130, CHIP: $3,651k) 


Another team for which it's difficult to make the case that injuries were a major contributing factor to being out of playoff contention.

Phoenix Coyotes (MGL: 115, CHIP: $3,323k) 


Lines and bars that stubbornly refuse to move north, however much everybody expects them to.

San Jose Sharks (MGL: 96, CHIP: $2,626k) 


The last of the relatively healthy Pacific Division teams - looks like they did benefit from this over the last 15-16 games.

St. Louis Blues (MGL: 122, CHIP: $3,873k) 


Clearly a much healthier first half than second, but also some serious mean-reversion going on with the possession numbers.

Vancouver Canucks (MGL: 160, CHIP: $6,500k) 


Ryan Kesler played Games 13-19 and 39-48, FYI. 

9 July 2013

The Pain Game: 5-year analysis (2008/09 - 2012/13) - Part II

This is the second of what will undoubtedly be a brief series of data dumps and inconclusive-yet-attractive charts aggregated over the last five (four and a bit...) NHL regular seasons, updated to include the bit that was the 2013 bit of a season.

Analyses of individual seasons (including explanations of the CHIP figures and their limitations) plus my previous aggregate analysis (aggreganalysis?) are at the following links:

2013 

Firstly, an updated ranking of teams by aggregate CHIP over the last five seasons (playoff teams highlighted; click to enlarge image):


Again, no obvious strong correlation between playoff qualification and the degree and quantity of injuries/illnesses suffered (see Part I for a more detailed representation of this).  Clearly still some quite wide differences in aggregate CHIP and MGL between top and bottom over the whole period.

As touched on in my end of season analysis, no great evidence to suggest that the incidence of injuries in the compressed season was greater than in previous years and the aggregate league CHIP figure as a proportion of the pro-rated cap was actually marginally the lowest of the five year sample.

The same figures grouped by division:


As was notable last year, the Pacific still appears to have suffered significantly fewer and less costly injuries (the four teams at the bottom of the aggregate CHIP table are all Pacific teams), the gap widening further since last year.  Just attributable to random variation over a relatively short period or a sign of better injury management or prevention by those teams (despite the complaining about travel schedules)?

2 July 2013

The Pain Game: 5-year analysis (2008/09 - 2012/13) - Part I

This is the first of what will undoubtedly be a brief series of data dumps and inconclusive-yet-attractive charts aggregated over the last five (four and a bit...) NHL regular seasons, updated to include the bit that was the 2013 bit of a season.

Analyses of individual seasons (including explanations of the CHIP figures and their limitations) plus my previous aggregate analysis (aggreganalysis?) are at the following links:

2013 
4-year analysis (2008/09 - 2011/12)

 Is there a correlation between injuries and a team's performance?

This is a plot of standings points per game against CHIP per game for each team over the last five seasons (click to enlarge):


By no means a comprehensive or detailed analysis - I suspect there are more than a few confounding variables creating a lot of noise - but this does at least suggest the correlation might not be as strong as you might initially expect (the R-squared coefficient is only 0.057, for what it's worth).

Do injuries increase with age?

Again, a reasonably crude measure, but the following chart shows total man-games lost to injury/illness over the last five seasons, distributed by the age of the player (as at the 1 January during each season - or before the 2013 season), plus the total number of games played by all players.

I've not attempted to make any adjustment for the fact that some of the games missed are attributable to season-long or career-ending absences, or that the games played number for goalies doesn't reflect the number of games they were available and dressed for.


A fairly useful illustration of the age profile of the NHL player population and the distribution of injury absences, but to make this a bit clearer, the next chart shows the crude proportion of games missed by each age cohort, expressed as MGL / (MGL + GP):


Sample sizes get pretty sketchy below age 20 and towards the late-30s, unsurprisingly, but enough here I think to support the ultra-controversial hypothesis that old people get stashed on LTIR by the Flyers when not wanted hurt more for longer.

Part II may well include another big fat grid of MGL and CHIP numbers by team and division over the five-year period, perhaps including an adjustment for distorting season-long absences.  Hold your breath.

17 May 2013

NHL Awards 2013 - meet the contenders

In most part due to certain events occurring in the approximate timeframe of September 2012 to January 2013 that nobody connected with the NHL will talk about until Jeremy Jacobs next holds a friendly season-opening press conference EVER again, the usual lamevish Las Vegas awards bash is apparently on hiatus for at least a year.

Instead, this year's winners "will be revealed in two live television specials during the Stanley Cup Final", which I presume means Pierre McGuire will be carrying out at least some of the envelope-opening, hardware-giving duties in between the benches late in the third period of a tied Game 7.

The Great One later discovered barricading his daughter in her bedroom would be futile in the digital age
Until that time, here is a quick rundown of the main awards (those that are voted on) and those in the running:

Hart Memorial Trophy

Voted on by: Members of the Professional Hockey Writers' Association
Supposed to be awarded to: The player adjudged most valuable to his team
In practice, normally awarded to: Whichever player got the votes of the only two writers who interpret "most valuable" in the same way

Sidney Crosby (Pittsburgh Penguins)
As well as his high skill level and competitive drive, famed for his high hockey IQ, although this apparently is not quite high enough to realise that the safest place to be to avoid a Brooks Orpik shot is directly in front of goal.

Alexander Ovechkin (Washington Capitals)
After something of a bounce-back campaign, now stands only 729 behind Pierre Turgeon's NHL record for most points scored after being buried by Dale Hunter.

John Tavares (New York Islanders)
Provides significantly more value than at least two of the players on the Islanders' payroll who have being a major award finalist on their résumés, by actually playing in games for the New York Islanders.

Ted Lindsay Award

Voted on by: Members of the National Hockey League Players' Association
Supposed to be awarded to: The most outstanding player in the NHL
In practice, normally awarded to: Ron Hainsey or Ryan Miller, if Don Fehr really wants to screw around with Gary Bettman and Jeremy Jacobs

Sidney Crosby (Pittsburgh Penguins)
Earned respect from the rank-and-file NHLPA members by spending much of October to January listening to a stream of extremely dull, PR-controlled rhetoric.  In between re-watching his DVR collection of interviews of himself, also found some time to attend a few labour meetings.

Alexander Ovechkin (Washington Capitals)
During the lockout, racked up 40 points in half a season playing against non-NHL calibre opposition.  In unrelated news, later scored 29 points in 18 games against Southeast Division teams.

Martin St. Louis (Tampa Bay Lightning)
Before achieving great success with the Lightning, was let go by the Calgary Flames for nothing at all, which is now widely regarded as the best return for a departing player the Flames have secured in the last 15 years.

James Norris Memorial Trophy

Voted on by: Members of the Professional Hockey Writers' Association   
Supposed to be awarded to: The defense player who demonstrates throughout the season the greatest all-round ability in the position
In practice, normally awarded to: Nicklas Lidstrom

Kris Letang (Pittsburgh Penguins)
No stranger to individual awards, having won in 2007 the QMJHL's Kevin Lowe Trophy, presented to the defenseman adjudged most likely to bitterly reminisce about his success as a player while sustaining a failed executive career.

P.K. Subban (Montreal Canadiens)
Believed to have the opportunity to become the first player with a hockey term within his name to win a major individual award, after the failed attempts of Victor Hedman, Tanner Glass, Paul Postma, Lindy Ruff and Rudy Pokecheck.

Ryan Suter (Minnesota Wild)
The free agent lured away from the Nashville Predators by the extremely lucrative, decade-plus contract sanctioned by an owner with close ties to the NHL commissioner, instantly solidified his playoff-bound team, almost exactly as Paul Holmgren drew it up.

Vezina Trophy

Voted on by: General Managers of all NHL clubs
Supposed to be awarded to: The goaltender who is adjudged to be the best at this position
In practice, normally awarded to: The goaltender who is adjudged to be at least as good as Jim Carey and Jose Theodore turned out to be

Sergei Bobrovsky (Columbus Blue Jackets)
Aiming to follow in the footsteps of the last Columbus goalie to be nominated for the award, by playing wretchedly enough to be wanted by the Philadelphia Flyers.

Henrik Lundqvist (New York Rangers)
Has a chance of being the second European repeat winner of the award, following Dominik Hasek, recipient in 1994 and 1995, 1997 to 1999, as well as 2018 and 2019.

Antti Niemi (San Jose Sharks)
Famously worked part-time as a Zamboni driver during his junior days in Finland, the hockey player/rink maintenance combination giving him something in common with teammate Scott Gomez, who is responsible for the sharp decline in coins and beer cups being thrown on the Bell Centre ice during Montreal Canadiens games.

Calder Memorial Trophy

Voted on by: Members of the Professional Hockey Writers' Association 
Supposed to be awarded to: The player selected as the most proficient in his first year of competition in the National Hockey League
In practice, normally awarded to: The player selected as the most proficient in what might be his third year of competition in the National Hockey League after what might be no or several years of competition in another professional league

Brendan Gallagher (Montreal Canadiens)
As a Canadian with an Irish name who was drafted by the Canadiens one spot after the Maple Leafs selected a Swede, has already ensured a legacy of providing Don Cherry with at least 15 years' worth of content for Coach's Corner.

Jonathan Huberdeau (Florida Panthers)
Born in 1993 and scorer of 14 goals in 48 games, making him the only candidate whose bio could also describe the team he plays for.

Brandon Saad (Chicago Blackhawks)
Led all rookies by a distance in the statistical categories of most goals scored while playing with Jonathan Toews and Marian Hossa and most assists gained while playing with Jonathan Toews and Marian Hossa.

Frank J. Selke Trophy

Voted on by: Members of the Professional Hockey Writers' Association 
Supposed to be awarded to: The forward who best excels in the defensive aspects of the game
In practice, normally awarded to: The 50-point forward who best excels in probably taking a few faceoffs, being "gritty" and showing "hustle", plus faring well in the ultra-reliable defensive statistics of plus/minus and takeaways

Patrice Bergeron (Boston Bruins)
As well as being a member of the prestigious Triple Gold Club consisting of players who have won an Olympic gold medal, a World Championships gold medal and the Stanley Cup, is also in the even more select group of players who have scored a playoff series winning goal against the Toronto Maple Leafs and do not have English as a first language, following in the most recent footsteps of Jeremy Roenick.

Pavel Datsyuk (Detroit Red Wings)
Looking to win this award for the fourth time, which would tie him with Hall of Famer Bob Gainey, who was credited with significantly reducing the number of goals conceded by the Montreal Canadiens between 1973 and 1989 as well as the New York Rangers between 2011 and 2013.

Jonathan Toews (Chicago Blackhawks)
The youngest person (at 22 years, 41 days) to gain entry into the aforementioned Triple Gold Club, a feat to impress everyone except teammate, Patrick Kane, who boasts of earning VIP membership of at least 75 different clubs in Chicago by the age of 20.

Bill Masterton Memorial Trophy

Voted on by: Members of the Professional Hockey Writers' Association 
Supposed to be awarded to: The player who best exemplifies the qualities of perseverance, sportsmanship and dedication to hockey
In practice, normally awarded to: The player who missed the most games through injury the season before

Sidney Crosby (Pittsburgh Penguins)
"Continued to evolve his game" and "a career-best plus-26 rating" are among the irrelevant reasons for his candidacy noted in the NHL.com awards feature, the Penguins' actual endorsement of "definitely not being Matt Cooke" mysteriously not being referred to.

Josh Harding (Minnesota Wild)
Among his other career accolades, winner of a silver medal at the World Junior Championships, so presumably the Masterton nomination is for finally escaping the prison to which Hockey Canada sends all its junior players that disgrace the country in that way.

Adam McQuaid (Boston Bruins)
Recovered from two surgeries resulting from Thoracic Outlet Syndrome, a condition sometimes developed by athletes who frequently raise their arms above the head, meaning Zdeno Chara now has at least one fewer congratulatory tap on the helmet when he scores a goal.

Lady Byng Memorial Trophy

Voted on by: Members of the Professional Hockey Writers' Association 
Supposed to be awarded to: The player adjudged to have exhibited the best type of sportsmanship and gentlemanly conduct combined with a high standard of playing ability
In practice, normally awarded to: The player adjudged to have had the fewest penalty minutes when the voters quickly skim down the list of top 20 scorers five minutes before the deadline to send in their ballot

Patrick Kane (Chicago Blackhawks)
Presumably distraught on eventually finding out he wasn't in fact a finalist for the Lady Banger Trophy.

Matt Moulson (New York Islanders)
Drafted in 2003 by the Pittsburgh Penguins and quickly becoming the best goalie drafted in 2003 by the Pittsburgh Penguins.

Martin St. Louis (Tampa Bay Lightning)
Travels at high speed around the rink, most often directly towards goal, seemingly only a few feet from the ice, all characteristics that have the unfortunate side-effect of making him invisible to Lightning goaltenders.

Jack Adams Award

Voted on by: Members of the NHL Broadcasters' Association 
Supposed to be awarded to: The coach adjudged to have contributed the most to his team's success
In practice, normally awarded to: The coach adjudged to have the most candidates for the Masterton Trophy next year

Bruce Boudreau (Anaheim Ducks)
After being dismissed by the Washington Capitals in 2011, became the fastest coach to be hired after being fired in the NHL, although that sentence from Wikipedia possibly contains a small typo.

Paul MacLean (Ottawa Senators)
Famously spotted in close proximity to his doppelgänger near the bench during one game this season, bringing back memories of the Jack Adams winner in 1994, when Lou Lamoriello threatened to replace Jacques Lemaire late in the season with his reliable fall-back option, Jacques Lemaire.

Joel Quenneville (Chicago Blackhawks)
With 660 career regular season wins on his coaching record, on his current pace, can look forward to celebrating #700 around 15 games into the Blackhawks' 2013/14 season.

General Manager of the Year Award

Voted on by: General Managers of all NHL clubs and a panel of NHL executives, print and broadcast media 
Supposed to be awarded to: The top National Hockey League General Manager
In practice, normally awarded to: The National Hockey League General Manager Thought Most Likely To Be Persuaded By Other National Hockey League General Managers Not To Sign Any Restricted Free Agents To Offer Sheets This Summer

Marc Bergevin (Montreal Canadiens)
Notorious prankster who smoothed relations with the Francophone media and fans after the Randy Cunneyworth fiasco with his unique ability to conduct bilingual interviews using only a hand cupped under his armpit and squeezing his elbow to his ribs.

Bob Murray (Anaheim Ducks)
To avoid a repeat of a 2009 chair-throwing incident, the Ducks now employ Brian Burke to sit in the GM's seat whenever his former understudy returns to his office. At least that's the reason Burke is giving.

Ray Shero (Pittsburgh Penguins)
Made a series of smart in-season deals that would significantly enhance his credentials for this award by concentrating on making those deals with GMs who would be most likely to ensure that fewer than 30 GMs would be GMs when the voting took place.