28 May 2011

Stanley Cup Final 2011: A Viewer's Guide

So your team has (yet again) not made it as far as the Stanley Cup Final? So jaded by the long grind of playoff hockey that you can't summon the energy to write an intro different to the one you used last year?

If you have nothing better to do, why not use my viewer's guide? Score along at home during the series and if you break 30 points, a multi-million dollar prize will head your way. At least that's what Chris Drury and Shawn Horcoff told me...

(I accept no responsibility for the consequences if you instead turn this into a drinking game. Watching a few playoff games is no excuse for drunken debauchery. At least that's what the Montreal Police Department told me...)
  • Man in garish, fluorescent green outfit performing tired, attention-seeking act next to road team penalty box during game (2 pts)
  • Man in garish, fluorescent green outfit performing tired, attention-seeking act next to Ron MacLean during Coach's Corner segment (1 pt)
  • Versus or NBC displaying on-screen graphic to illustrate where Canada is (5 pts)
  • Versus or NBC displaying on-screen graphic to illustrate where Sidney Crosby is (10 pts)
  • Denis Leary dropping F-bomb accidentally-on-purpose during mid-game interview with rink-side reporter (6 pts)
  • Mike Emrick failing to mention which US college was attended by Ryan Kesler, Jeff Tambellini, Chris Higgins, Rich Peverley, Tim Thomas, the goal judge, his hotel receptionist etc... (8 million pts)
  • Eddie Olczyk's forced chuckle (2 pts)
  • "Good active stick" (-5 pts)
  • Jeremy Roenick clearly articulating a thoughtful, rational point during post-game coverage (100 pts)
  • Jeremy Roenick scribbling "JR needs a wee wee" using his virtual crayons during post-game coverage (40 pts)
  • Each CBC shot of Bruins President of Looking Angry in Executive Boxes, Cam Neely (1 pt) 
  • Each CBC shot of Maple Leafs President of Looking Angry in Executive Boxes Even Though My Team Isn't Taking Part, Brian Burke (0.1 pts)
  • Tom Brady watching the game while holding a goat (7 pts)
  • Funny looking bald guy shouting and getting up close to Bruins players during timeout (10 pts)
  • Claude Julien struggling to muscle past Pierre McGuire and/or Darren Pang to diagram a play for Bruins players during timeout (20 pts)
Coach Julien is not usually happy to be interviewed during the game
  • Adrien Plavsic (0 pts)
  • Jim Hughson or Mike Emrick calling the winning goal in OT to clinch the 2011 Stanley Cup (1 pt)
  • Jim Hughson or Mike Emrick finally calling the winning goal in OT to clinch the 2010 Stanley Cup (88 pts)
  • Andrew Ference raising the Cup over his head in triumph (5 pts)
  • Andrew Ference lowering his pants around his ankles in triumph (15 pts)
  • After the final game, Mark Recchi immediately bringing the end to a long, dinstinguished career, by announcing the retirement of the patch of hair above his forehead (43 pts)

26 May 2011

Throwing games in the NHL

[If the title led you to believe this would be an analysis of the team-building strategy of the Pittsburgh Penguins, I apologise.  It's not.]

The aftermath of the post-game torrent of giveaway paddles/clappers/rally drums launched by Tampa Bay fans onto the playing surface - and ever so accidentally in the general vicinity of one or two Boston Bruins players - last night has brought with it the usual furious, yet measured and consistent, response from NHL HQ today.

The Lightning organisation and the retaliating Nathan Horton have both been left reeling from the respective heavy fine and suspension laid down by the league.

Far from being rare, of course there have been many instances of unusual objects being discarded onto the ice at hockey arenas over the years.  Here is just a small selection:

Octopi
As every hockey fan knows, Detroit Red Wings fans have been lobbing octopi on the ice during the playoffs since the 1950s, the eight arms originally signifying the number of wins necessary to win the Stanley Cup. Recently the NHL has begun to frown upon the ritual, a crackdown on eight animal limbs hitting the playing surface first instituted by Colin Campbell in response to Sean Avery spilling the contents of Martin Brodeur's KFC bargain bucket during the 2008 playoffs.

A wooden bench
In January 2000, irate at a missed call, New Jersey Devils coach Robbie Ftorek opted to throw part of the team bench onto the ice. The Devils' well-established run-and-gun system allowed the bench to seamlessly fit in on a line with John Madden and Jay Pandolfo, chalking up a creditable +12 rating over the balance of the season, before signing a lucrative but ultimately disastrous free agent deal with the New York Rangers that summer.

Plastic rats
In one of several short-lived crazes aping Detroit's octupus tossing, during one of their team's regular marches to the Stanley Cup Final in 1996, Florida Panthers fans took to littering the ice with plastic rats whenever the Panthers scored, apparently instigated by the story of Scott Mellanby killing a (real) rat in the dressing room. The practice is also thought to have inspired the recent throwing of plastic dogs after every Michael Vick touchdown in Philadelphia.

Confetti
The Vancouver Canucks faced criticism this week for allowing confetti to be showered onto the ice after clinching the Western Conference championship, the sight of players consequently being forced to skate very slowly to avoid injury only bringing back bad memories of Mats Sundin's time in the city.

Waffles
After famously throwing waffles onto the Air Canada Centre ice to express his displeasure at the Toronto Maple Leafs' loss to the Atlanta Thrashers earlier this season, die-hard fan Joe Robb avoided criminal charges but was forced to carry out five hours of community service and is now banned from ever again watching the Atlanta Thrashers play at Air Canada Centre.

Rubber snake
Following an internet-led campaign, a Keith Yandle goal in a 2010 playoff game against Detroit resulted in one Phoenix Coyotes fan flinging a rubber snake onto the ice. Originally believed to be motivated as a riposte to the Red Wings' octopus tradition, it later emerged that the sacrifice of a hairless, predatory and cold-blooded object merely symbolised the rejection of Jim Balsillie's as the team's potential owner.

Hats
The throwing of hats on the ice after a player scores a hat-trick goal has long been embraced by players and fans alike, a tradition only threatened by league spokesman Sidney Crosby's complaints during a 2009 playoff game about the sheer volume of hats being thrown in his direction by the Capitals' Dave Steckel.

A glove
In the final minute of a tied December 2008 game between the Philadelphia Flyers and Tampa Bay Lightning, popular Flyers forward Scott Hartnell attempted to thwart a breakaway by Ryan Malone by throwing his glove towards the Lightning player, resulting in a penalty shot being awarded and missed, thus astonishing Flyers fans under the age of 40, who had never before seen the glove of a Flyers player prevent a goal.

Tennis balls
The annual college match-up between Dartmouth and Princeton includes the ritual of Dartmouth fans hurling tennis balls onto the ice after their team's first goal of the game. The continuation of that tradition at Madison Square Garden for each goal scored by star New York Rangers forward and Dartmouth alum, Hugh Jessiman, is believed to have extinguished the entire stock of tennis balls in Manhattan.

2 May 2011

NHL Awards - meet the contenders

Somewhat lost in the excitement of the playoffs over the last couple of weeks have been the announcements about the nominees for the various NHL awards (those that are voted on).

Once again, these are to be handed out in a faintly embarrassing lavish ceremony in Las Vegas in June attended by whoever comes up first on Bettman's "Best Rock of the 80s" iPod playlist some of the entertainment industry's biggest names and Eric Weinrich and Darcy Wakaluk many legends of the game.

Here is a quick rundown of the main awards and those in the running:


Hart Memorial Trophy

Supposed to be awarded to: The player adjudged most valuable to his team
In practice, normally awarded to: The player with the most points and/or who happened to get hot in the last month of the season

Corey Perry (Anaheim)
Aiming to become the first MVP since Bobby Clarke in 1975/76 to rack up 100 penalty minutes in the season, thus creating the instant quiz question: "How the hell did Chris Pronger go a season without getting 100 penalty minutes?"

Daniel Sedin (Vancouver)
There is simply no other player like him.

Martin St. Louis (Tampa Bay)
Put the team on his shoulders and carried them, the team promising to return the favour during a planned off-season trip to Disneyland.

James Norris Memorial Trophy

Supposed to be awarded to: The defense player who demonstrates throughout the season the greatest all-round ability in the position
In practice, normally awarded to: Nicklas Lidstrom

Zdeno Chara (Boston)
Neutralised the offense of Max Pacioretty and Ryan Callahan more effectively than any other player in the league could manage.

Nicklas Lidstrom (Detroit)
Continued to defy conventional wisdom by putting up the first minus season of his career despite playing much less often in front of Chris Osgood.

Shea Weber (Nashville)
First Norris Trophy nomination for a player with an Irish name since Sandis O'Zolinsh in 1997.

Vezina Trophy

Supposed to be awarded to: The goaltender who is adjudged to be the best at this position
In practice, normally awarded to: The goaltender who is adjudged to be at least as good as Jim Carey and Jose Theodore turned out to be

Roberto Luongo (Vancouver)
Strong performance attributed to playing 12 inches deeper in his crease and Dustin Byfuglien playing 600 miles deeper in the Eastern Conference.

Pekka Rinne (Nashville)
Hoping to become the first Finnish goalie to pick up some hardware since Brian Burke sent Vesa Toskala to Canadian Tire to collect his new lawnmower.

Tim Thomas (Boston)
Rewarded for breaking Dominik Hasek's long-standing NHL record for most saves made while looking like an inebriated octopus playing Twister.

Calder Memorial Trophy

Supposed to be awarded to: The player selected as the most proficient in his first year of competition in the National Hockey League
In practice, normally awarded to: The player selected as the most proficient in what might be his third year of competition in the National Hockey League after what might be no or several years of competition in another professional league

Logan Couture (San Jose)
Consistent scorer over the long NHL season after being a less consistent scorer over the 40 NHL games he played last year.

Michael Grabner (New York Islanders)
Impending impressive season and his many suitors triggered Dale Tallon to start the Panthers' annual fire sale before Game #1.

Jeff Skinner (Carolina)
Highly promising rookie campaign means Jim Rutherford will surely look to re-acquire his services from other teams three or four times over his career.

Frank J. Selke Trophy

Supposed to be awarded to: The forward who best excels in the defensive aspects of the game
In practice, normally awarded to: The forward who best excels in the defensive aspects of the game while having the offensive ability to score at least 50 points

Pavel Datsyuk (Detroit)
Incredibly, was not on the ice for a single goal conceded by the Wings during any of the 26 games he missed through injury.

Ryan Kesler (Vancouver)
Strong in all the areas the voters look for in determining the best defensive forward, most importantly in scoring a lot more goals than last year.

Jonathan Toews (Chicago)
Credited with significantly reducing the Hawks' goals against over the course of the season due to his suggestion to the coaching staff that Marty Turco should maybe start fewer games.

Bill Masterton Memorial Trophy

Supposed to be awarded to: The player who best exemplifies the qualities of perseverance, sportsmanship and dedication to hockey
In practice, normally awarded to: The player who missed the most games through injury the season before

Ray Emery (Anaheim)
Despite showing up for his first practice a personal best four months late, beat enormously long odds to become the more sympathetic character of the Ducks' goalie tandem alongside Dan Ellis.

Daymond Langkow (Calgary)
Displayed remarkable commitment, bolstering Calgary's lack of depth at center during his 78-game absence by matching Matt Stajan's production.

Ian Laperriere (Philadelphia)
Showed huge determination in his personal quest to prove that the Masterton Award is not a "Comeback Player" award by not coming back at all.

Lady Byng Memorial Trophy

Supposed to be awarded to: The player adjudged to have exhibited the best type of sportsmanship and gentlemanly conduct combined with a high standard of playing ability
In practice, normally awarded to: The player adjudged to have had the fewest penalty minutes when the voters quickly skim down the list of top 20 scorers five minutes before the deadline to send in their ballot

Loui Eriksson (Dallas)
Only 8 penalty minutes for the Swedish forward, meaning he only lost patience and speared Steve Ott once every 20 games.

Nicklas Lidstrom (Detroit)
Six-time winner, perennial All-Star and future Hall of Famer demonstrated admirable restraint by not throttling Versus reporters referring to him as Nicholas Lindstrom at the All-Star Game.

Martin St. Louis (Tampa Bay)
Voters were apparently convinced by his claims that he had nothing to do with Guy Boucher's scar.

Jack Adams Award

Supposed to be awarded to: The coach adjudged to have contributed the most to his team's success
In practice, normally awarded to: The coach adjudged to have coached a team to a position somewhere between 5th and 8th in the conference

Dan Bylsma (Pittsburgh)
Led the league in the all-important media-friendly statistical category of Most Appearances in High-Profile Documentary While Swearing Fewer Times Than Bruce Boudreau.

Barry Trotz (Nashville)
Steered an offensively-challenged line-up to a playoff berth and calmly handled controversial mid-season addition of Randy Moss.

Alain Vigneault (Vancouver)
Coached his team to a 54-19-9 record in undoubtedly one of the American Hockey League's strongest divisions.

General Manager of the Year Award

Supposed to be awarded to: Brian Burke
In practice, normally awarded to: The top National Hockey League General Manager

Mike Gillis (Vancouver)
Backed his belief that extra goalscoring was not necessary for his team by acquiring the likes of Dan Hamhuis, Keith Ballard and Chris Higgins.

David Poile (Nashville)
Veteran GM has refused to waver in his position that Coach Trotz's neck has never been on the block.

Steve Yzerman (Tampa Bay)
Earned high praise from the Canadian media for showing superb prowess in the areas of being Steve Yzerman, not being associated with the previous ownership and somehow managing to find a better goalie than Mike Smith.

1 May 2011

The Pain Game - 3-year analysis (2008/09 - 2010/11)

Nothing much more than a data dump of aggregate figures here, having compiled three years' worth of stuff now.

Analyses of individual seasons (including explanations of the figures and their limitations) are at the following links:


 Firstly, a ranking of teams by aggregate CHIP over the last three seasons (click to enlarge):


The same figures grouped by division:


The largest ten and smallest ten CHIP figures by a team in a single season over the last three:


The largest ten CHIP figures accumulated by a player in a single season over the last three:

23 April 2011

The Pain Game 2010/11 - end of season wrap

Injury stats update – end of season awards

This is the final update for the 2010/11 regular season looking at which teams have been hit hardest by injuries by trying to place a value on the games missed by players due to injury/illness.  (Last month's analysis is HERE.)

The concept again - multiply each game missed by a player by his 2010/11 cap charge, then take the aggregate of these figures for each team and divide by 82. This indicator of value lost to a team by injury/illness is called CHIP (Cap Hit of Injured Players).

Alternatively...
Again, for a different indicator of player "value", I've also illustrated a similar metric based on TOI/G alongside the CHIP numbers.  Clearly, neither cap charge nor TOI/G are perfect measures of player value, since each have a number of limitations and inconsistencies, but they provide a decent comparison and the results do vary somewhat.

A quick summary of the alternative metric:
  • TOI/G replaces cap charge as the measure of value in the calculation
  • For goalies, TOI/G has been worked out as Total Minutes Played / Games Dressed For* - i.e. a goalie playing every minute of 75% of the games, zero in the rest, would end up with a TOI/G of 45 minutes (or close to it, once you factor in OT and so on).  [*Actually, "Games Played by Team - Games Missed by Goalie" - I'm not inclined to disentangle any three-goalie systems or minor-league conditioning stints.]
  • This arguably overstates the worth of starting goalies somewhat, but it's simple and you could equally argue that a workhorse goalie is the hardest position to replace, so it's fair for them to have a much higher TOI/G figure
  • Where a player hasn't played all year (several examples at this point of the season) or where a player fairly clearly has a reduced TOI/G figure due to getting injured in their only game or one of very few games, I've used TOI/G from last season (or further back if necessary)
  • For each player, multiply games missed by TOI/G to get (for a more palatable name) Cumulative Minutes of Injured Player (CMIP)
  • Take the aggregate of CMIP for the team and divide by games played by the team to arrive at AMIP (Average Minutes of Injured Players) - it feels more understandable expressing this metric as an average per game (whereas CHIP is a running total)
The figures...
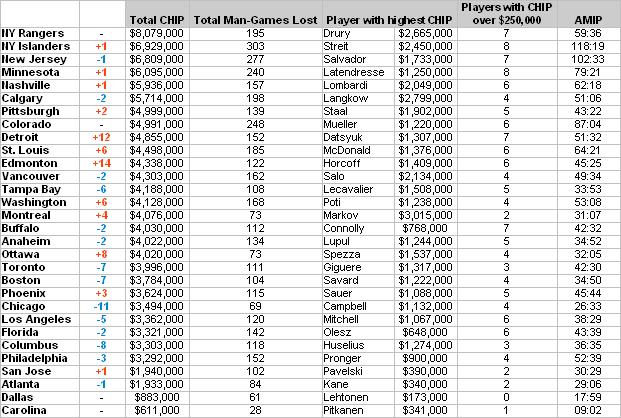
The table below (playoff teams highlighted in yellow) shows:
  • Total CHIP for each team over the 2010/11 regular season
  • The player who has contributed most to the team's CHIP figure
  • The number of players with a CHIP contribution of over $250,000 (think of it as being equivalent to a $1m player missing 20 games or a $4m player missing five games)
  • AMIP for each team over the same period (e.g. an AMIP of 40:00 could be seen as the team missing two 20-minute per game players for every game this season)

For a further breakdown, the following table also shows the distribution of CHIP by position for each team:


10 second analysis...
After a late surge that surely nobody could have seen coming, given the scandalous lack of media coverage, the Penguins clinch the title of Most Benign Videos of a Player Appearing at Practice Released to the Public Most Injured Team in the NHL 2010/11.

The plucky Rangers saw their chance of an unprecedented worst-to-first run dashed by Ryan Callahan's inability to break himself on a Zdeno Chara slapshot quite early enough in the season and Glen Sather's unfathomable decision not to tack another million per year on Derek Boogaard's bargain contract.

At the other end of the table, Carolina's rather massive separation from the field only made my amusement at their Game 82 wipeout increase, when their colour analyst (colour: orange) Tripp Tracy decided to claim injuries were a major factor in the team's failure to make the playoffs within two minutes of the game ending.

Despite the cluster of non-playoff teams towards the top of the CHIP table, I'm still not that convinced there is much of a correlation with performance overall - of those teams, only really the Devils' failure could be argued as being much of a surprise.

Not sure how the injured Penguins forwards have been rated as having more value than the long Drury/Boogaard absences for the Rangers, but then I never claimed the system was perfect.  And where would the Senators, Leafs, Wild and Islanders have been without the costly injuries to Leclaire, Giguere, Harding and a bunch of minor league goalies respectively?

Now I have three years' worth of the data (2008/09 analysis and 2009/10 analysis), I will consider doing a post with some sort of wider annual comparisons.  For now, worth noting that the league-wide aggregate CHIP figure of around $234m is higher than each of the last two years - though increases in average contract size may well play a part in this.

The next lists are the top 30 individual CHIP and CMIP contributions:

Andrei Markov follows up a strong 13th place finish in 2009/10 to just hold off Captain Clutch for the individual CHIP title.  Surely cause for celebration in Montreal.  Stay away from parked cars, Andrei.

Mark Streit's season-long presence in the press box would have been a crushing blow for the Islanders.  Had he not had his credentials revoked by the team in November, of course.

Players who missed all 82 games: Sauer (Phoenix), Mueller (Colorado), Harding (Minnesota), Sheppard (Minnesota), Salvador (New Jersey), Streit (NY Islanders), Laperriere (Philadelphia), Bitz (Florida).

Where does it hurt?
This is another update of the crude injury-by-location analysis. Again, I’ve just used the descriptions found in the player profiles on tsn.ca, so the figures will encompass all the inaccuracies and vagueness within them. It should give a broad indication, if nothing else, though.


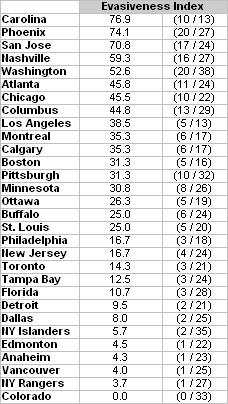
And as an extra, further final bonus, a final look at the Evasiveness Index.  This is basically the proportion of injury instances for each team that have been described as either "Undisclosed" or the helpfully pointless "Upper/Lower Body" in the same TSN profiles.  I have made no judgement about whether the many instances of "Illness" (i.e. concussion), "Flu" (i.e. concussion) or even "Boogaard Shoulder" (i.e. concussion) should also be included.

Carolina uncharacteristically blew their chance of victory here by deciding to disclose a couple of injuries down the stretch.  Greg Sherman clearly has a lot to learn, or too much time on his hands, managing to disclose each one of 46 different injuries to 29 different players.  Not including Peter Forsberg.


Notes/Disclaimers
  • Figures exclude a few minor-leaguers / marginal NHLers who are or had been on the NHL club’s IR since pre-season. Generally, if a minor-leaguer gets called up and then injured in an NHL game, his games missed will then count towards the CHIP though.  I've tried to exclude minor-league conditioning stints immediately after/during a period on IR from the man-games lost figures
  • There are undoubtedly a few inaccuracies and inconsistencies in there - I do the best I can with the information out there. Some corrections are picked up month-to-month too
  • The cap figure doesn't really correlate very well to the "worth" of a player in some cases, e.g. where rookie bonuses are included this year, where players are seeing out an old (underpaid or rookie) contract or where players are horrendously overpaid
  • Also, for any player who was acquired on re-entry waivers (e.g. Sean Avery), the cap hit will only reflect that for their current team, i.e. 50% of the player’s full cap hit (shared between his current and old teams)
  • I've once again stuck a full team-by-team listing of games missed and CHIP/CMIP numbers by each player on the web HERE
  • Injury/games/TOI info courtesy of tsn.ca and nhl.com - man-games lost info more than likely does not exactly match up with the "official" figures released by individual teams
  • Cap info courtesy of capgeek.com

12 March 2011

The Pain Game 2010/11 - Part Five

Injury stats update – February 2011

This is my penultimate look for the 2010/11 regular season at which teams have been hit hardest by injuries by trying to place a value on the games missed by players due to injury/illness.  (Last month's analysis is HERE.)

The concept again - multiply each game missed by a player by his 2010/11 cap charge, then take the aggregate of these figures for each team and divide by 82. This indicator of value lost to a team by injury/illness is called CHIP (Cap Hit of Injured Players).

Alternatively...
Again, for a different indicator of player "value", I've also illustrated a similar metric based on TOI/G alongside the CHIP numbers.  Clearly, neither cap charge nor TOI/G are perfect measures of player value, since each have a number of limitations and inconsistencies, but they provide a decent comparison and the results do vary somewhat.

A quick summary of the alternative metric:
  • TOI/G (through games played on 28 February) replaces cap charge as the measure of value in the calculation
  • For goalies, TOI/G has been worked out as Total Minutes Played / Games Dressed For* - i.e. a goalie playing every minute of 75% of the games, zero in the rest, would end up with a TOI/G of 45 minutes (or close to it, once you factor in OT and so on).  [*Actually, "Games Played by Team - Games Missed by Goalie" - I'm not inclined to disentangle any three-goalie systems or minor-league conditioning stints.]
  • This arguably overstates the worth of starting goalies somewhat, but it's simple and you could equally argue that a workhorse goalie is the hardest position to replace, so it's fair for them to have a much higher TOI/G figure
  • Where a player hasn't played all year (several examples at this point of the season) or where a player fairly clearly has a reduced TOI/G figure due to getting injured in their only game or one of very few games, I've used TOI/G from last season (or further back if necessary)
  • For each player, multiply games missed by TOI/G to get (for a more palatable name) Cumulative Minutes of Injured Player (CMIP)
  • Take the aggregate of CMIP for the team and divide by games played by the team to arrive at AMIP (Average Minutes of Injured Players) - it feels more understandable expressing this metric as an average per game (whereas CHIP is a running total)
The figures...
The table below shows:
  • Total CHIP for each team for the 2010/11 regular season (through games played on 28 February)
  • The player who has contributed most to the team's CHIP figure
  • The number of players with a CHIP contribution of over $250,000 (think of it as being equivalent to a $1m player missing 20 games or a $4m player missing five games)
  • AMIP for each team over the same period (e.g. an AMIP of 40:00 could be seen as the team missing two 20-minute per game players for every game this season)

For a further breakdown, the following table also shows the distribution of CHIP by position for each team:


10 second analysis...
The horrendous travel schedule in the Atlantic Division is clearly the single biggest contributing factor in the presence of 80% of the division in the top four slots, now that the Penguins have risen (somebody should really have publicised their recent injuries - I'd never have noticed otherwise...)

The recent emergency call-ups of Dave Babych and Adrien Plavsic by the Canucks prompted my thought to break down the CHIP figures by position.  Somewhat more instructive to see, therefore, the Canucks and Canadiens 2nd and 3rd in defensemen CHIP (CHID?) as you might anticipate.  Less instructive to see them still lagging behind Mark Streit and a plethora of minor-league D-men in first place.

And the Islanders, Leafs and Senators can clearly point to injuries as being a huge factor behind their goaltending performances falling behind their normally impeccable standards.  Or something...

The next lists are the top 30 individual CHIP and CMIP contributions:

Does Sid the Kid have enough time and remaining cap hit to catch long-time favourites Drury and Markov?  Sure, I could work it out, but where is the tension in doing that?

Where does it hurt?
This is another update of the crude injury-by-location analysis. Again, I’ve just used the descriptions found in the player profiles on tsn.ca, so the figures will encompass all the inaccuracies and vagueness within them. It should give a broad indication, if nothing else, though.


And as an extra, further final bonus, a second look at the Evasiveness Index introduced last month.  This is basically the proportion of injury instances for each team that have been described as either "Undisclosed" or the helpfully pointless "Upper/Lower Body" in the same TSN profiles.  I have made no judgement about whether the many instances of "Illness" (i.e. concussion), "Flu" (i.e. concussion) or even "Boogaard Shoulder" (i.e. concussion) should also be included.

It will be mildly interesting to see if teams become more evasive down the stretch.  Pittsburgh for one, seem to have suddenly clammed up when it comes to injury disclosure.  A policy that sadly has not yet extended to its TV broadcast team.


Notes/Disclaimers
  • Figures exclude a few minor-leaguers / marginal NHLers who are or had been on the NHL club’s IR since pre-season. Generally, if a minor-leaguer gets called up and then injured in an NHL game, his games missed will then count towards the CHIP though.  I've tried to exclude minor-league conditioning stints immediately after/during a period on IR from the man-games lost figures
  • There are undoubtedly a few inaccuracies and inconsistencies in there - I do the best I can with the information out there. Some corrections are picked up month-to-month too
  • The cap figure doesn't really correlate very well to the "worth" of a player in some cases, e.g. where rookie bonuses are included this year, where players are seeing out an old (underpaid or rookie) contract or where players are horrendously overpaid
  • Also, for any player who was acquired on re-entry waivers (e.g. Sean Avery), the cap hit will only reflect that for their current team, i.e. 50% of the player’s full cap hit (shared between his current and old teams)
  • I've once again stuck a full team-by-team listing of games missed and CHIP/CMIP numbers by each player on the web HERE
  • Injury/games/TOI info courtesy of tsn.ca and nhl.com - man-games lost info more than likely does not exactly match up with the "official" figures released by individual teams
  • Cap info courtesy of capgeek.com

30 January 2011

The Pain Game 2010/11 - Part Four

Injury stats update – January 2011

This is my fourth look for the 2010/11 regular season at which teams have been hit hardest by injuries by trying to place a value on the games missed by players due to injury/illness.  (Last month's analysis is HERE.)

The concept again - multiply each game missed by a player by his 2010/11 cap charge, then take the aggregate of these figures for each team and divide by 82. This indicator of value lost to a team by injury/illness is called CHIP (Cap Hit of Injured Players).

Alternatively...
Again, for a different indicator of player "value", I've also illustrated a similar metric based on TOI/G alongside the CHIP numbers.  Clearly, neither cap charge nor TOI/G are perfect measures of player value, since each have a number of limitations and inconsistencies, but they provide a decent comparison and the results do vary somewhat.

A quick summary of the alternative metric:
  • TOI/G (through games played up to the All-Star break) replaces cap charge as the measure of value in the calculation
  • For goalies, TOI/G has been worked out as Total Minutes Played / Games Dressed For* - i.e. a goalie playing every minute of 75% of the games, zero in the rest, would end up with a TOI/G of 45 minutes (or close to it, once you factor in OT and so on).  [*Actually, "Games Played by Team - Games Missed by Goalie" - I'm not inclined to disentangle any three-goalie systems or minor-league conditioning stints.]
  • This arguably overstates the worth of starting goalies somewhat, but it's simple and you could equally argue that a workhorse goalie is the hardest position to replace, so it's fair for them to have a much higher TOI/G figure
  • Where a player hasn't played all year (several examples at this point of the season) or where a player fairly clearly has a reduced TOI/G figure due to getting injured in their only game or one of very few games, I've used TOI/G from last season (or further back if necessary)
  • For each player, multiply games missed by TOI/G to get (for a more palatable name) Cumulative Minutes of Injured Player (CMIP)
  • Take the aggregate of CMIP for the team and divide by games played by the team to arrive at AMIP (Average Minutes of Injured Players) - it feels more understandable expressing this metric as an average per game (whereas CHIP is a running total)
The figures...
The table below shows:
  • Total CHIP for each team for the 2010/11 regular season (through games played up to the All-Star break)
  • The player who has contributed most to the team's CHIP figure
  • The number of players with a CHIP contribution of over $250,000 (think of it as being equivalent to a $1m player missing 20 games or a $4m player missing five games)
  • AMIP for each team over the same period (e.g. an AMIP of 40:00 could be seen as the team missing two 20-minute per game players for every game this season)

10 second analysis...
The Rangers' injury-fest continues, with Christensen, Girardi, Dubinsky, Fedotenko and Frolov all going down in January for varying lengths of time.  Of the bigger movers elsewhere in the table, Chicago's remaining big-ticket players have stayed healthy recently, while Detroit (Datsyuk, Cleary, Holmstrom, Stuart) and last year's #1 CHIP team, Edmonton (Hemsky, Horcoff, Whitney, Eberle) are moving in the other direction.

The next lists are the top 30 individual CHIP and CMIP contributions:


As could be expected, both lists are now starting to be dominated by players out all year, including some likely to remain out all year.  Chris Drury's clutch 10 minutes per game contributions since his return should help him slip down the CMIP list rather rapidly.

BONUS
Finally, another update of the crude injury-by-location analysis. Again, I’ve just used the descriptions found in the player profiles on tsn.ca, so the figures will encompass all the inaccuracies and vagueness within them. It should give a broad indication, if nothing else, though.


And as an extra, further final bonus, I introduce the Evasiveness Index.  This is basically the proportion of injury instances for each team that have been described as either "Undisclosed" or the helpfully pointless "Upper/Lower Body" in the same TSN profiles.  I have made no judgement about whether the many instances of "Illness" (i.e. concussion), "Flu" (i.e. concussion) or even "Boogaard Shoulder" (i.e. concussion) should also be included.

Arguably, we can see a weak correlation between the higher ratings and some of the smaller, southern markets with presumably less voraciously investigative media and fans, while two NY teams (OK, the Islanders perhaps a bad example...) and a cluster of Canadian teams are rated lower.

Clearly, a small sample size for Carolina so far, but a quick check back to last year shows the Rutherford/Maurice tag-team went a strong 23-for-37 then too (EI of 62.2), so maybe not just a freak number this year.


Notes/Disclaimers
  • Figures exclude a few minor-leaguers / marginal NHLers who are or had been on the NHL club’s IR since pre-season. Generally, if a minor-leaguer gets called up and then injured in an NHL game, his games missed will then count towards the CHIP though.  I've tried to exclude minor-league conditioning stints immediately after/during a period on IR from the man-games lost figures
  • There are undoubtedly a few inaccuracies and inconsistencies in there - I do the best I can with the information out there. Some corrections are picked up month-to-month too
  • The cap figure doesn't really correlate very well to the "worth" of a player in some cases, e.g. where rookie bonuses are included this year, where players are seeing out an old (underpaid or rookie) contract or where players are horrendously overpaid
  • Also, for any player who was acquired on re-entry waivers (e.g. Sean Avery), the cap hit will only reflect that for their current team, i.e. 50% of the player’s full cap hit (shared between his current and old teams)
  • I've once again stuck a full team-by-team listing of games missed and CHIP/CMIP numbers by each player on the web HERE
  • Injury/games/TOI info courtesy of tsn.ca and nhl.com - man-games lost info more than likely does not exactly match up with the "official" figures released by individual teams
  • Cap info courtesy of capgeek.com